Answered step by step
Verified Expert Solution
Question
1 Approved Answer
please answer fully and completely for a guaranteed thumbs up. please do it in a timely manner as well! let me know if more info
please answer fully and completely for a guaranteed thumbs up. please do it in a timely manner as well! 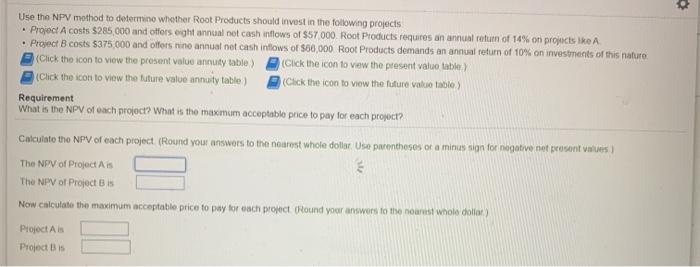
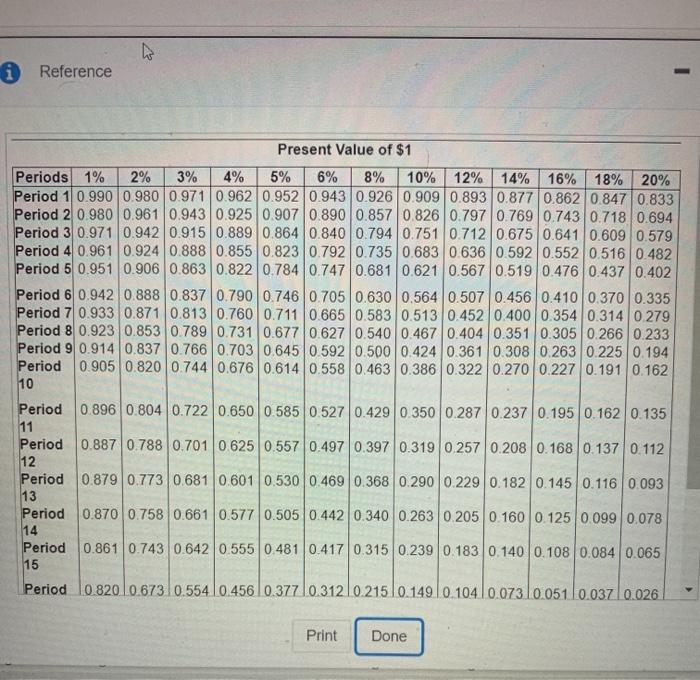
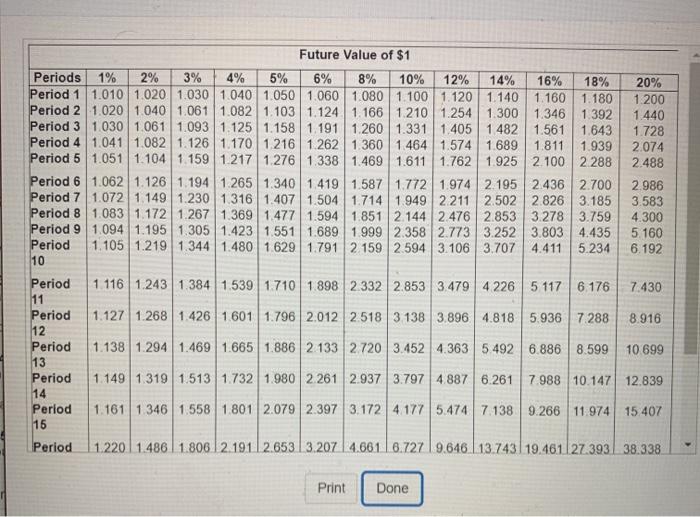
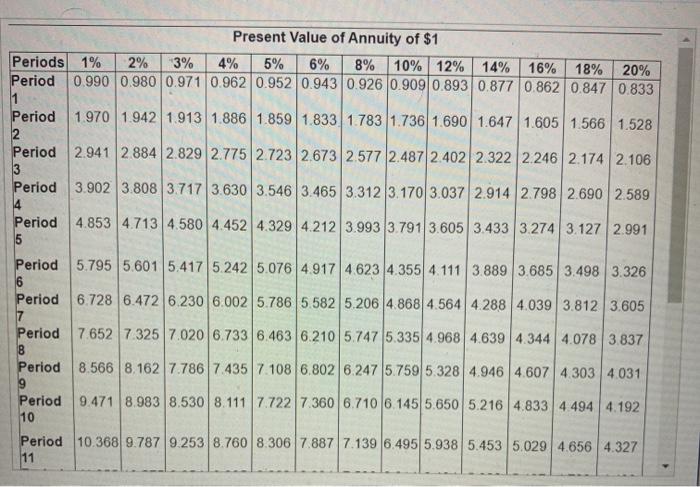
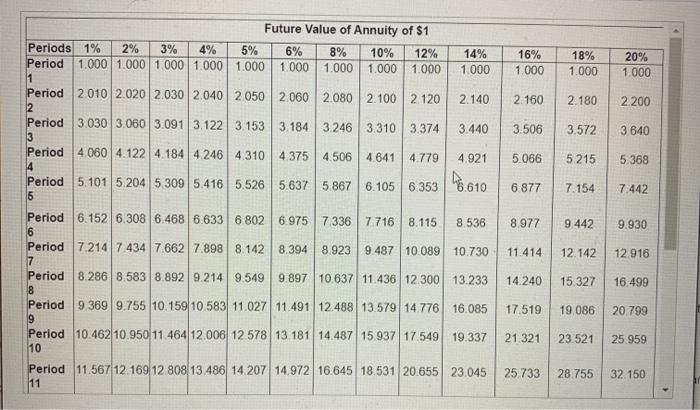
Use the NPV method to determine whether Root Products should invest in the following projects Project A costs $285,000 and offerseght annual net cash inflows of $57 000. Root Products requires an annual return of 14% on projects like Project costs $375,000 and offers nino annual net cash inflows of 560,000 Root Products demands an annual return of 10% on investments of this nature (Click the icon to view the present value annuty table) Click the icon to view the present value table> (Click the icon to view the future value annuity table) (Click the icon to view the future value table) Requirement What is the NPV of each project? What is the maxmum acceptable price to pay for each project? Calculate tho NPV of each project. (Round your answers to the nearest whole dottor. Use parentheses or a meus sign for nogative net peocenit vinters) The NPV of Project is The NPV of Projects Now calculate the maximum acceptable price to pay for each project round your answers to the nearest wnole dolar) Project As Project is 0 Reference - Present Value of $1 Periods 1% 2% 3% 4% 5% 6% 8% 10% 12% 14% 16% 18% 20% Period 1 0.990 0.980 0.971 0.962 0.952 0.943 0.926 0.909 0.893 0.877 0.862 0.847 0.833 Period 2 0.980 0.961 0.943 0.925 0.9070.890 0.857 0.826 0.797 0.769 0.743 0.7180.694 Period 3 0.971 0.942 0.915 0.889 0.864 0.840 0.794 0.751 0.712 0.675 0.641 0.609 0.579 Period 4 0.961 0.924 0.888 0.855 0.8230.792 0.735 0.683 0.636 0.592 0.552 0.516 0.482 Period 5 0.951 0.906 0.863 0.822 0.784 0.747 0.681 0.621 0.567 0.519 0.476 0.437 0.402 Period 6 0.942 0.888 0.837 0.790 0.746 0.705 0.630 0.564 0.507 0.456 0.410 0.370 0.335 Period 7 0.933 0.871 0.813 0.7600.711 0.665 0.583 0.513 0.452 0.400 0.354 0.314 0.279 Period 8 0.923 0.853 0.789 0.731 0.677 0.627 0.540 0.467 0.404 0.351 0.305 0.266 0.233 Period 9 0.914 0.837 0.766 0.703 0.6450.592 0.500 0.424 0.361 0.308 0.263 0.225 0.194 Period 0.905 0.820 0.744 0.676 0.614 0.558 0.463 0.386 0.322 0.270 0.227 0.191 0.162 10 Period 0.896 0.8040.722 0.650 0.585 0.527 0.429 0.350 0.287 0.237 0.195 0.162 0.135 11 Period 0.887 0.788 0.701 0.625 0.557 0.497 0.397 0.319 0.257 0.208 0.168 0.137 0.112 12 Period 0.879 0.773 0.681 0.601 0.530 0.4690.368 0.290 0.229 0.182 0.145 0.116 0.093 13 Period 0.870 0.758 0.6610.577 0.505 0.442 0.340 0.263 0.205 0.160 0.125 0.099 0.078 14 Period 0.861 0.743 0.642 0.555 0.481 0.417 0.315 0.239 0.183 0.140 0.108 0.084 0.065 15 Period 10.82010.673 0.5540.456 0.37710 31210.21510.149 10 104 10.073 10.051 0.037 0.026 Print Done Future Value of $1 Periods 1% 2% 3% 4% 5% 6% 8% 10% 12% 14% 16% 18% Period 1 1.010 1.020 1.030 1.040 1.050 1.000 1.080 1.100 1.120 1.140 1.160 1.180 Period 2 1.020 1040 1.061 1.0821.103 1.124 1.166 1210 1.254 1.300 1.346 1.392 Period 3 1030 1.061 1.093 1.125 1.158 1.191 1.260 1.331 1.405 1.482 1.561 1.643 Period 4 1.0411082 1.126 1.170 1 216 1.262 1.360 1.464 1.5741.689 1.811 1.939 Period 5 1.0511.104 1.159 1.217 1276 1.338 1.469 1.611 1.762 1.925 2.100 2.288 Period 6 1.062 1.126 1.194 1.265 1.340 1.419 1.587 1.772 1.9742.195 2.436 2.700 Period 7 1.072 1.149 1.230 1316 1.407 1.504 1.7141.949 2211 2.502 2.826 3.185 Period 8 1.083 1.172 1.267 1.369 1477 1.594 1.851 2.144 2.476 2.853 3.278 3.759 Period 9 1.094 1.195 1.305 1.4231.551 1.689 1999 2.3582.773 3.252 3.803 4.435 Period 1.105 1.219 1.344 1.480 1629 17912 159 2 594 3.106 3.707 4.411 5.234 10 20% 1.200 1.440 1.728 2.074 2.488 2.986 3.583 4.300 5 160 6.192 1 116 1.243 1384 1.539 1710 1 898 2.332 2.8533.479 4 226 5 117 6 176 7.430 1.127 1.268 1.426 1601 1.796 2.01225183 138 3.896 4.818 5.9367288 8.916 Period 11 Period 12 Period 13 Period 14 Period 15 1.138 1.2941.469 1.665 1.886 2133 2720 3.452 4.363 5 492 6.886 8.599 10 699 1.149 1.319 1.513 1732 1.980 2.261 2.937 3.797 4.8876.2617.988 10.147 12.839 1.1611 346 1.558 1.8012.079 2.397 3.172 4177 5.474 7 138 9.266 11 974 15,407 Period 1.220 1.486 1.806.12.1912.653 3.207 4.661 | 6.727 9.646.13.74319.461127.393 38.338 Print Done 8% Present Value of Annuity of $1 Periods 1% 2% 3% 4% 5% 6% 10% 12% 14% 16% 18% 20% Period 0.990 0.980 0.971 0.962 0.952 0.943 0.926 0.909 0.893 0.877 0.862 0.847 0.833 1 Period 1.970 1.942 1.913 1.886 1.859 1.833 1.783 1.736 1.6901.647 1.605 1.566 1.528 2 Period 2.941 2 884 2.829 2.775 2.723 2.673 2577 2.487 2.402 2.322 2.246 2.174 2.106 3 Period 3.902 3.808 3.7173.630 3.546 3.465 3.312 3.1703.037 2.914 2.798 2.690 2.589 14 Period 4.853 4.713 4.580 4.452 4.329 4.212 3.993 3.791 3.605 3.433 3.274 3.127 2.991 5 Period 5.795 5.601 5.417 5.242 5.076 4.917 4.623 4.355 4.111 3.889 3.685 3.498 3.326 6 Period 6.728 6.472 6230 6.002 5.786 5.5825.206 4.868 4.564 4.288 4.0393.812 3.605 Period 7.652 7.325 7.0206.733 6.463 6.210 5.7475.335 4.968 4.639 4.344 4.0783.837 B Period 8.566 8.162 7.786 7.435 7.108 6.8026.247 5.759 5.328 4.946 4.607 4 303 4.031 9 Period 9.471 8.983 8.530 8.1117.722 7.360 6.710 6.145 5.650 5.216 4.833 4.494 4.192 10 Period 10.368 9.7879.253 8.760 8.306 7.887 7.139 6.495 5.938 5.453 5.029 4.656 4.327 11 16% 1.000 18% 1.000 20% 1.000 2 160 2.180 2.200 3.506 3.572 3.640 5.066 5 215 5.368 6 877 7.154 7 442 Future Value of Annuity of $1 Periods 1% 2% 3% 4% 5% 6% 8% 10% 12% 14% Period 1.000 1.000 1.000 1.000 1.000 1.000 1.000 1.000 1.000 1.000 1 Period 2.010 2.020 2030 2040 2050 2060 2080 2.100 2.120 2.140 2 Period 3.030 3.060 3.091 3.122 3.153 3.184 3 246 3.310 3.374 3.440 3 Period 4 060 4.122 4.1844 246 4.310 4 375 4.506 4641 4.779 4.921 4 Period 5.101 5.204 5.309 5.416 5.526 5.637 5.867 6.105 6353 8610 5 Period 6.152 6.308 6.468 6.6336 802 6.975 7.3367.716 8.115 8.536 6 Period 72147 434 7.662 7.898 8.142 8.394 8.923 9.487 10.089 10.730 7 Period 8.286 8.583 8.8929.214 9.549 9.897 10.637 11.436 12.300 13.233 8 Period 9 369 9.755 10.159 10.583 11.027 11.491 12.488 13.579 14776 16.085 9 Period 10.462 10.950 11.464 12.006 12 578 13 181 14.48715 93717 549 19.337 10 Period 11.567 12 169 12 808 13.486 14 207 14.972 16.645 18.531 20.655 23.045 11 8.977 9442 9.930 11.414 12.142 12.916 14.240 15.327 16.499 17.519 19,086 20.799 21.321 23 521 25.959 25 733 28.755 32 150 let me know if more info is needed


Step by Step Solution
There are 3 Steps involved in it
Step: 1

Get Instant Access to Expert-Tailored Solutions
See step-by-step solutions with expert insights and AI powered tools for academic success
Step: 2

Step: 3

Ace Your Homework with AI
Get the answers you need in no time with our AI-driven, step-by-step assistance
Get Started


