Answered step by step
Verified Expert Solution
Question
1 Approved Answer
PLEASE ANSWER IN MATLAB CODE 4. (25 pts) The T -x- y diagram in Problem 3 can be obtained without performing bubble and dew point
PLEASE ANSWER IN MATLAB CODE
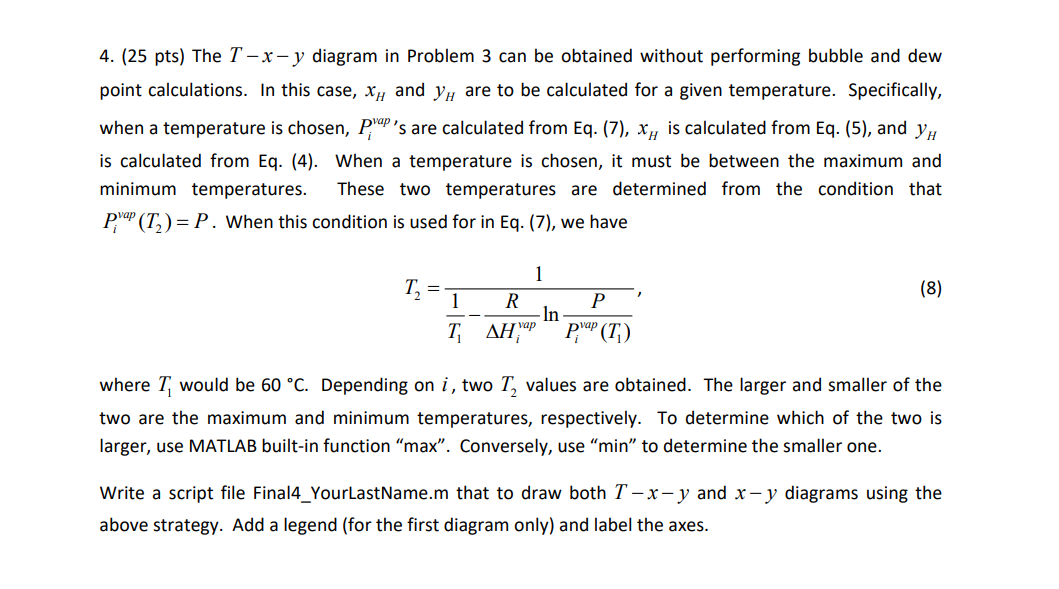
4. (25 pts) The T -x- y diagram in Problem 3 can be obtained without performing bubble and dew point calculations. In this case, xand y, are to be calculated for a given temperature. Specifically, when a temperature is chosen, Pia's are calculated from Eq. (7), X, is calculated from Eq. (5), and y is calculated from Eq. (4). When a temperature is chosen, it must be between the maximum and minimum temperatures. These two temperatures are determined from the condition that pap (T,)=P. When this condition is used for in Eq. (7), we have (8) 1 1 R In T AHMap P." (T) where I would be 60 C. Depending on i, two T, values are obtained. The larger and smaller of the two are the maximum and minimum temperatures, respectively. To determine which of the two is larger, use MATLAB built-in function "max". Conversely, use "min" to determine the smaller one. Write a script file Final4_YourLastName.m that to draw both T X-y and x- y diagrams using the above strategy. Add a legend (for the first diagram only) and label the axes. 4. (25 pts) The T -x- y diagram in Problem 3 can be obtained without performing bubble and dew point calculations. In this case, xand y, are to be calculated for a given temperature. Specifically, when a temperature is chosen, Pia's are calculated from Eq. (7), X, is calculated from Eq. (5), and y is calculated from Eq. (4). When a temperature is chosen, it must be between the maximum and minimum temperatures. These two temperatures are determined from the condition that pap (T,)=P. When this condition is used for in Eq. (7), we have (8) 1 1 R In T AHMap P." (T) where I would be 60 C. Depending on i, two T, values are obtained. The larger and smaller of the two are the maximum and minimum temperatures, respectively. To determine which of the two is larger, use MATLAB built-in function "max". Conversely, use "min" to determine the smaller one. Write a script file Final4_YourLastName.m that to draw both T X-y and x- y diagrams using the above strategy. Add a legend (for the first diagram only) and label the axesStep by Step Solution
There are 3 Steps involved in it
Step: 1
Get Instant Access to Expert-Tailored Solutions
See step-by-step solutions with expert insights and AI powered tools for academic success
Step: 2
Step: 3
Ace Your Homework with AI
Get the answers you need in no time with our AI-driven, step-by-step assistance
Get Started