Please answer it with steps and explanations. Thanks!
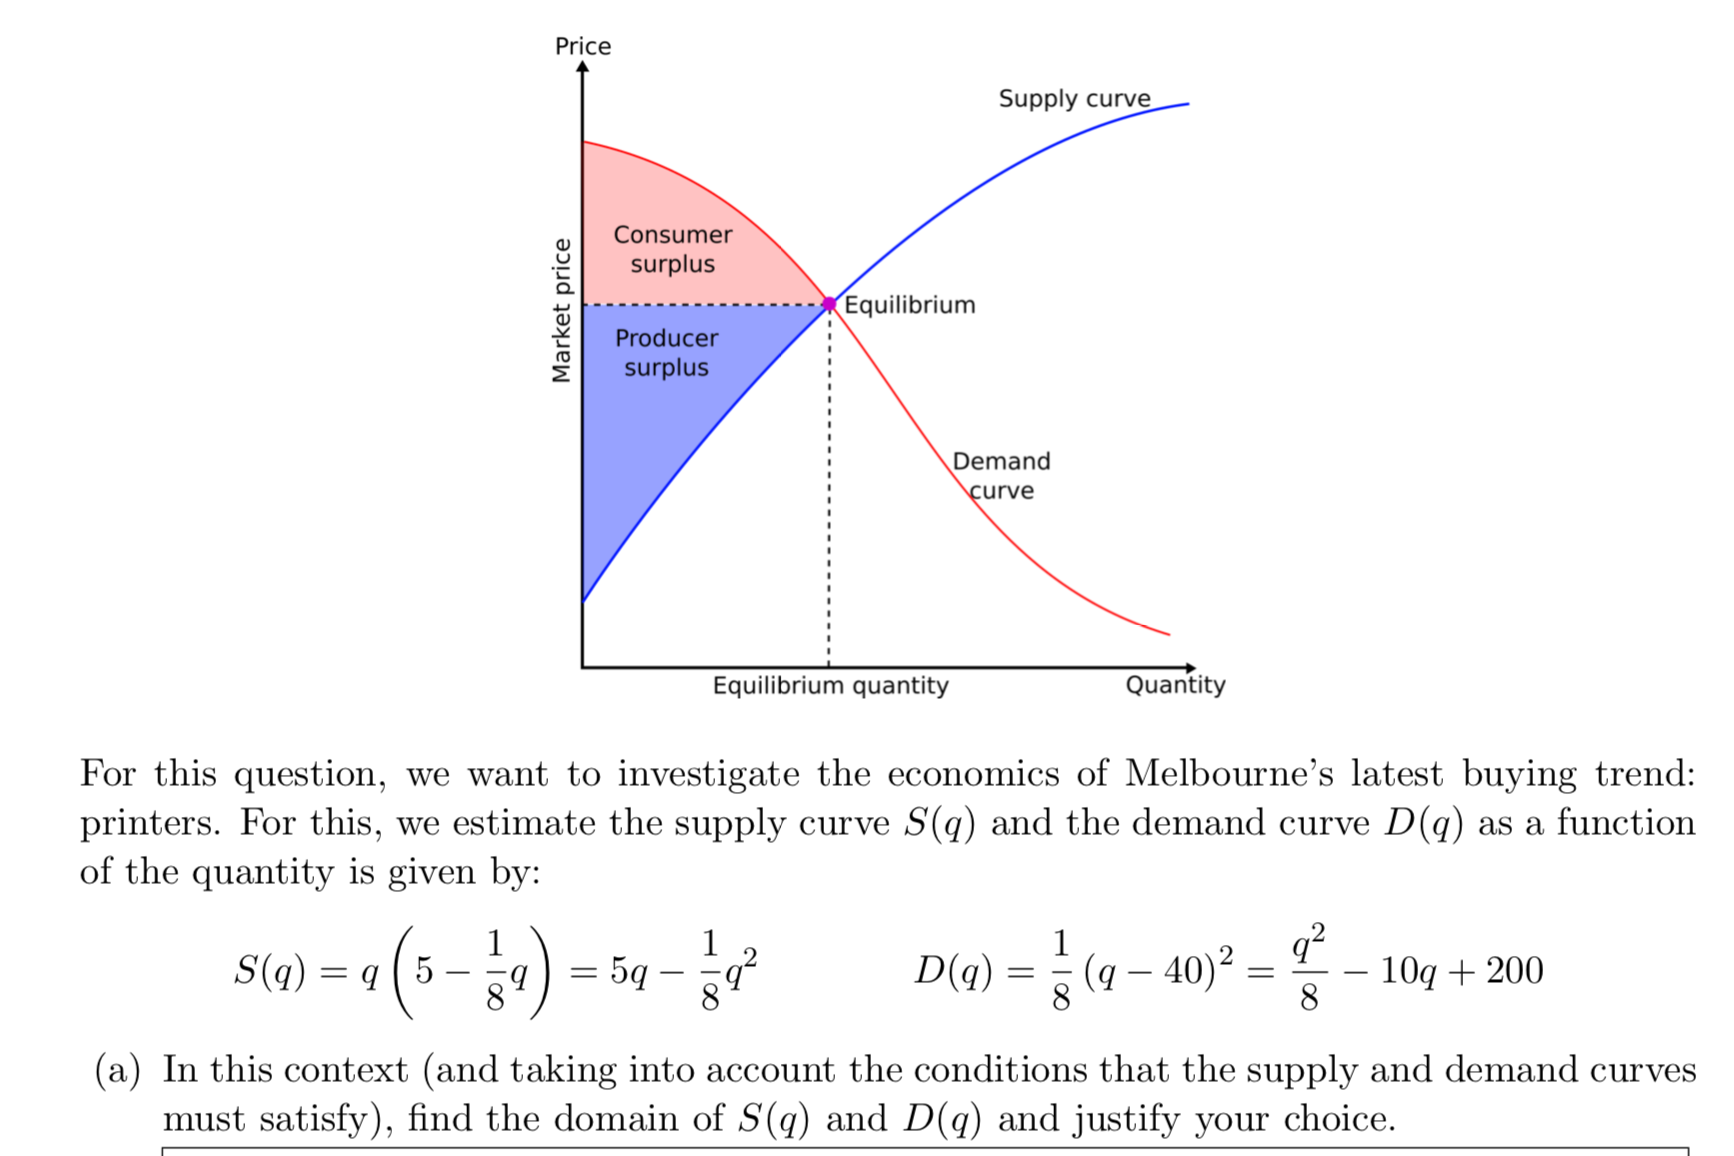
2. In economics, a standard supply and demand diagram is a plot between the quantity of goods and the price. Here are a few things we need to know about this diagram. There are two functions we are interested in on this diagram The rst function is called the supply curve. It is a relation between the quantity of goods a supplier is willing to produce at a given price. This is a increasing function since suppliers are more willing to produce a higher quantity of goods if they can be sold at a higher price. The second function is call the demand curve. It is a relation between the quantity of goods consumers are willing to buy at a given price. This is a decreasing function since consumers are willing to buy more at a lower price and vice versa. The intersection of these two curves is called the equilibrium, or market price. This is the price where the quantity of goods produced by the supplier is equal to the quantity of goods that consumers are willing to purchase. The producer surplus (in $) is the area above the supply curve and below the equilibrium price. This quantity roughly translates to prot as it is the monetary gain by the supplier by selling at the market price instead of the lowest price that they are willing to sell for. The consumer surplus (in $) is the area below the demand curve and above the equilib rium price. This is the money saved by the consumer by purchasing goods at the market price instead of the maximum price that they are willing to pay. This information can be summed up in the following diagram (from Wikipedia). The same article provides additional details if you are interested. Price Supply curve Consumer surplus Equilibrium Market price Equilibrium quantity Quantity For this question, we want to investigate the economics of Melbourne's latest buying trend: printers. For this, we estimate the supply curve 8 (q) and the demand curve D(q) as a function of the quantity is given by: q2 1 1 2 1 2 = = D = 4 = 1 2 5(q) q(5 Sq) 5q 89! (q) 8(q 0) 8 0q+ 00 (a) In this context (and taking into account the conditions that the supply and demand curves must satisfy), nd the domain of S (q) and D(q) and justify your choice. (b) Find the market price of this system and the quantity q that produces this equilibrium. You may use a graph or calculator to guess where the equilibrium might be, but this solution should be validated algebraically. (c) Based on your results for the previous parts, determine the producer surplus and consumer surplus of this system


