Answered step by step
Verified Expert Solution
Link Copied!

Question

1 Approved Answer

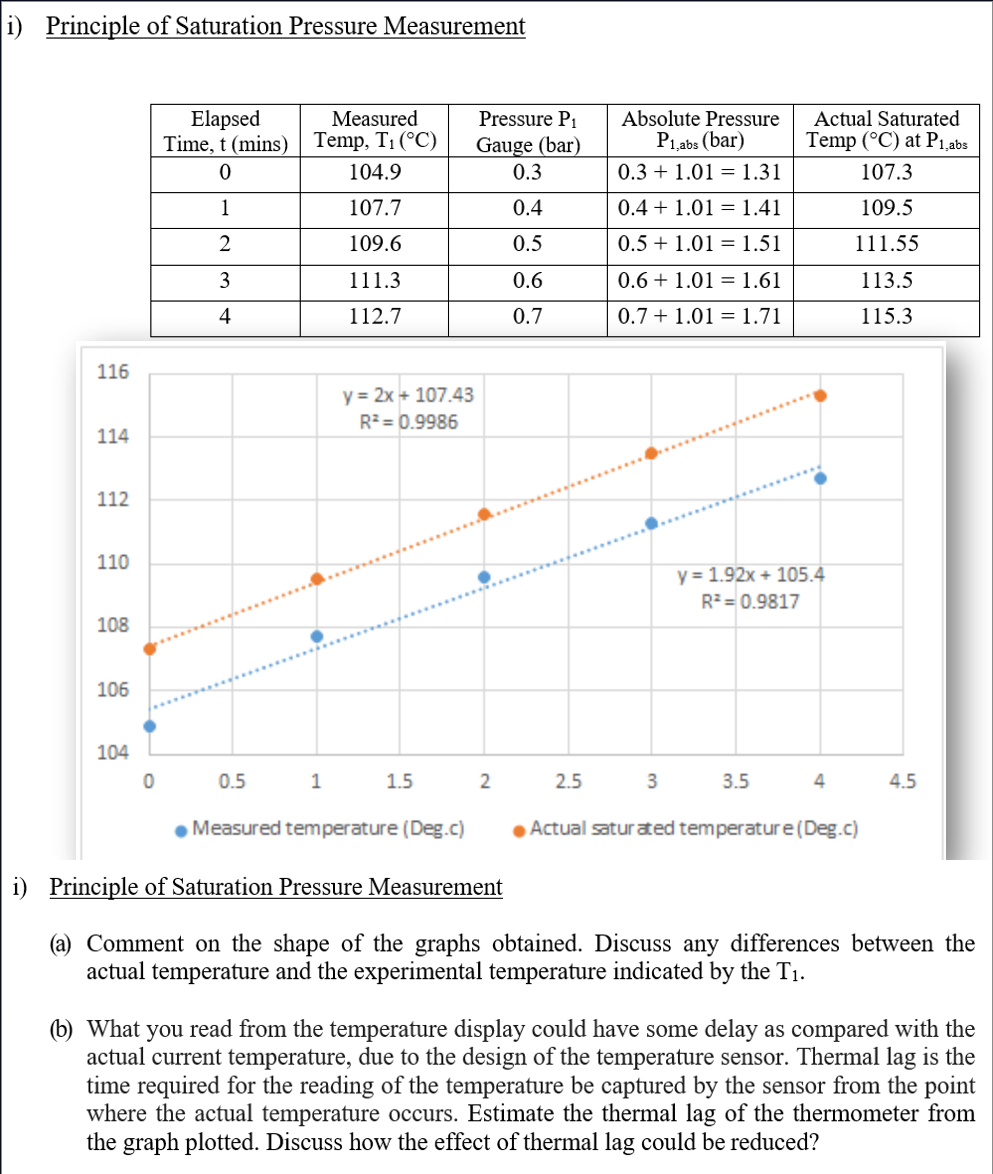
Please answer parts (a) and (b) by referring to the graph plotted as shown below thanks. i) Principle of Saturation Pressure Measurement i) Principle of

Please answer parts (a) and (b) by referring to the graph plotted as shown below thanks.

image text in transcribed

i) Principle of Saturation Pressure Measurement i) Principle of Saturation Pressure Measurement (a) Comment on the shape of the graphs obtained. Discuss any differences between the actual temperature and the experimental temperature indicated by the T1. (b) What you read from the temperature display could have some delay as compared with the actual current temperature, due to the design of the temperature sensor. Thermal lag is the time required for the reading of the temperature be captured by the sensor from the point where the actual temperature occurs. Estimate the thermal lag of the thermometer from the graph plotted. Discuss how the effect of thermal lag could be reduced

Step by Step Solution

There are 3 Steps involved in it

Step: 1

blur-text-image

Get Instant Access to Expert-Tailored Solutions

See step-by-step solutions with expert insights and AI powered tools for academic success

Step: 2

blur-text-image

Step: 3

blur-text-image

Ace Your Homework with AI

Get the answers you need in no time with our AI-driven, step-by-step assistance

Get Started

Recommended Textbook for

Introduction to Chemical Engineering Thermodynamics

Authors: J. M. Smith, H. C. Van Ness, M. M. Abbott

7th edition

71247084, 978-0071247085

More Books

Students also viewed these Chemical Engineering questions

Question

Azure Analytics is a suite made up of which three tools?

Answered: 1 week ago