Answered step by step
Verified Expert Solution
Question
1 Approved Answer
please answer questions and show work, i give like Exarmine the ANOVA output below. This analysis was conducted to see the number of detective processors
please answer questions and show work, i give like 
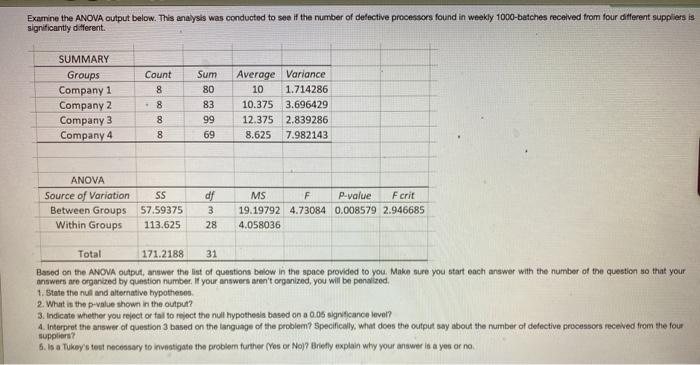
Exarmine the ANOVA output below. This analysis was conducted to see the number of detective processors found in weekly 1000-batches received trom four different suppliers is significantly different. SUMMARY Groups Company 1 Company 2 Company 3 Company 4 Count 8 8 8 8 Sum 80 83 99 69 Average Variance 10 1.714286 10.375 3.696429 12.375 2.839286 8.625 7.982143 ANOVA Source of Variation SS Between Groups 57.59375 Within Groups 113.625 df 3 28 MS F P-value Fcrit 19.19792 4.73084 0.008579 2.946685 4.058036 Total 171.2188 31 Based on the ANOVA output, answer the list of questions below in the space provided to you. Make sure you start each answer with the number of the question so that your answers are organized by question number. If your answers aren't organized, you will be penalized 1. State the nul and alternative hypotheses 2. What is the p-value shown in the output? 3. Indicate whether you reject or fail to reject the null hypothesis based on a 0.06 significance level? 4. Interpret the answer of question 3 based on the language of the problem? Specifically, what does the output say about the number of defective processors received from the four suppliers? 6.16 Tukeys test necessary to invvatigate the problem further (Yes or No)? Briefly explain why your answer is a yes or no Exarmine the ANOVA output below. This analysis was conducted to see the number of detective processors found in weekly 1000-batches received trom four different suppliers is significantly different. SUMMARY Groups Company 1 Company 2 Company 3 Company 4 Count 8 8 8 8 Sum 80 83 99 69 Average Variance 10 1.714286 10.375 3.696429 12.375 2.839286 8.625 7.982143 ANOVA Source of Variation SS Between Groups 57.59375 Within Groups 113.625 df 3 28 MS F P-value Fcrit 19.19792 4.73084 0.008579 2.946685 4.058036 Total 171.2188 31 Based on the ANOVA output, answer the list of questions below in the space provided to you. Make sure you start each answer with the number of the question so that your answers are organized by question number. If your answers aren't organized, you will be penalized 1. State the nul and alternative hypotheses 2. What is the p-value shown in the output? 3. Indicate whether you reject or fail to reject the null hypothesis based on a 0.06 significance level? 4. Interpret the answer of question 3 based on the language of the problem? Specifically, what does the output say about the number of defective processors received from the four suppliers? 6.16 Tukeys test necessary to invvatigate the problem further (Yes or No)? Briefly explain why your answer is a yes or no 
Step by Step Solution
There are 3 Steps involved in it
Step: 1

Get Instant Access to Expert-Tailored Solutions
See step-by-step solutions with expert insights and AI powered tools for academic success
Step: 2

Step: 3

Ace Your Homework with AI
Get the answers you need in no time with our AI-driven, step-by-step assistance
Get Started


