Please answer the below questions with correct excel formula in excel sheet and detailed explanation. Questions Burlington has tracked daily sales of coats for the
Please answer the below questions with correct excel formula in excel sheet and detailed explanation.
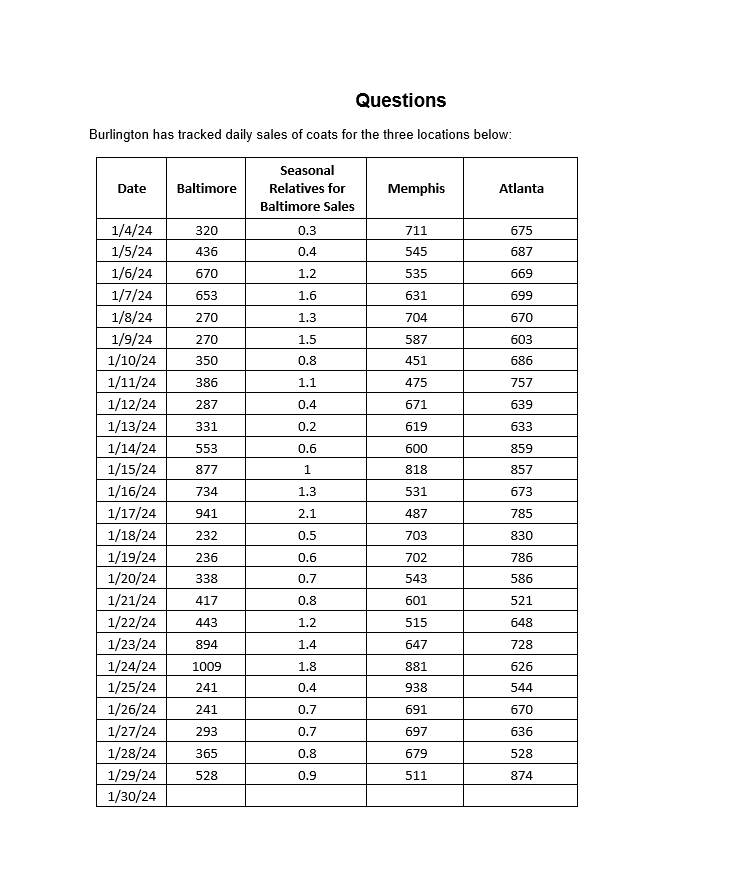
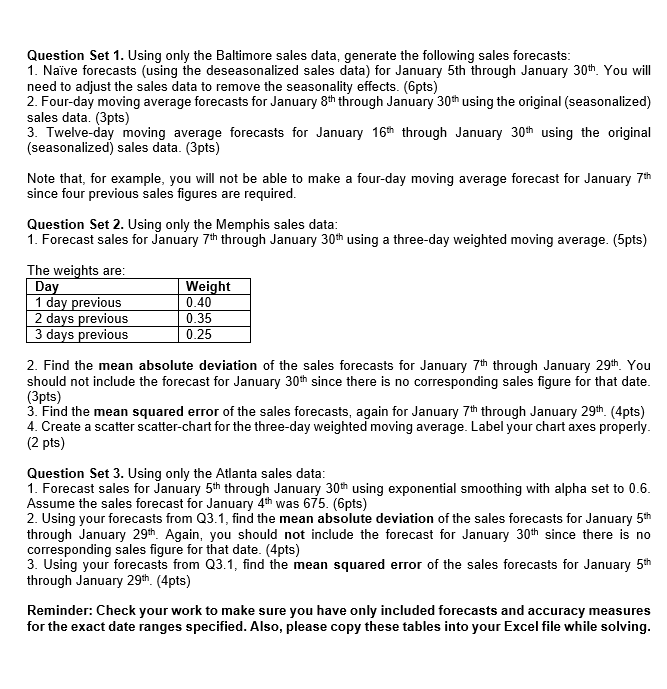
Questions Burlington has tracked daily sales of coats for the three locations below: Seasonal Date Baltimore Relatives for Memphis Atlanta Baltimore Sales 1/4/24 320 0.3 711 675 1/5/24 436 0.4 545 587 1/6/24 570 1.2 535 569 1/7/24 653 1.6 631 599 1/8/24 270 1.3 704 670 1/9/24 270 1.5 587 603 1/10/24 350 0.8 451 586 1/11/24 386 1.1 475 757 1/12/24 287 0.4 671 539 1/13/24 331 0.2 619 633 1/14/24 553 0.6 600 359 1/15/24 877 1 818 857 1/16/24 734 1.3 531 573 1/17/24 941 2.1 487 785 1/18/24 232 0.5 703 830 1/19/24 236 0.6 702 786 1/20/24 338 0.7 543 586 1/21/24 417 0.8 601 521 1/22/24 443 1.2 15 548 1/23/24 894 1.4 647 728 1/24/24 1009 1.8 881 526 1/25/24 241 0.4 938 544 1/26/24 241 0.7 691 670 1/27/24 293 0.7 697 1/28/24 365 0.8 679 528 1/29/24 528 0.9 511 874 1/30/24Question Set 1. Using only the Baltimore sales data, generate the following sales forecasts: 1. Naive forecasts (using the deseasonalized sales data) for January 5th through January 30th. You will need to adjust the sales data to remove the seasonality effects. (6pts) 2. Four-day moving average forecasts for January 8" through January 30th using the original (seasonalized) sales data. (3pts) 3. Twelve-day moving average forecasts for January 16th through January 30th using the original (seasonalized) sales data. (3pts) Note that, for example, you will not be able to make a four-day moving average forecast for January 7th since four previous sales figures are required. Question Set 2. Using only the Memphis sales data: 1. Forecast sales for January 7th through January 30th using a three-day weighted moving average. (5pts) The weights are: Day Weight 1 day previous 0.40 2 days previous 0.35 3 days previous 0.25 2. Find the mean absolute deviation of the sales forecasts for January 7th through January 29th. You should not include the forecast for January 30" since there is no corresponding sales figure for that date. (3pts) 3. Find the mean squared error of the sales forecasts, again for January 7" through January 29th. (4pts) 4. Create a scatter scatter-chart for the three-day weighted moving average. Label your chart axes properly. (2 pts) Question Set 3. Using only the Atlanta sales data: 1. Forecast sales for January 5" through January 30th using exponential smoothing with alpha set to 0.6. Assume the sales forecast for January 4th was 675. (6pts) 2. Using your forecasts from Q3.1, find the mean absolute deviation of the sales forecasts for January 5th through January 29th. Again, you should not include the forecast for January 30th since there is no corresponding sales figure for that date. (4pts) 3. Using your forecasts from Q3.1, find the mean squared error of the sales forecasts for January 5th through January 29th. (4pts) Reminder: Check your work to make sure you have only included forecasts and accuracy measures for the exact date ranges specified. Also, please copy these tables into your Excel file while solving
Step by Step Solution
There are 3 Steps involved in it
Step: 1
Get Instant Access to Expert-Tailored Solutions
See step-by-step solutions with expert insights and AI powered tools for academic success
Step: 2
Step: 3
Ace Your Homework with AI
Get the answers you need in no time with our AI-driven, step-by-step assistance