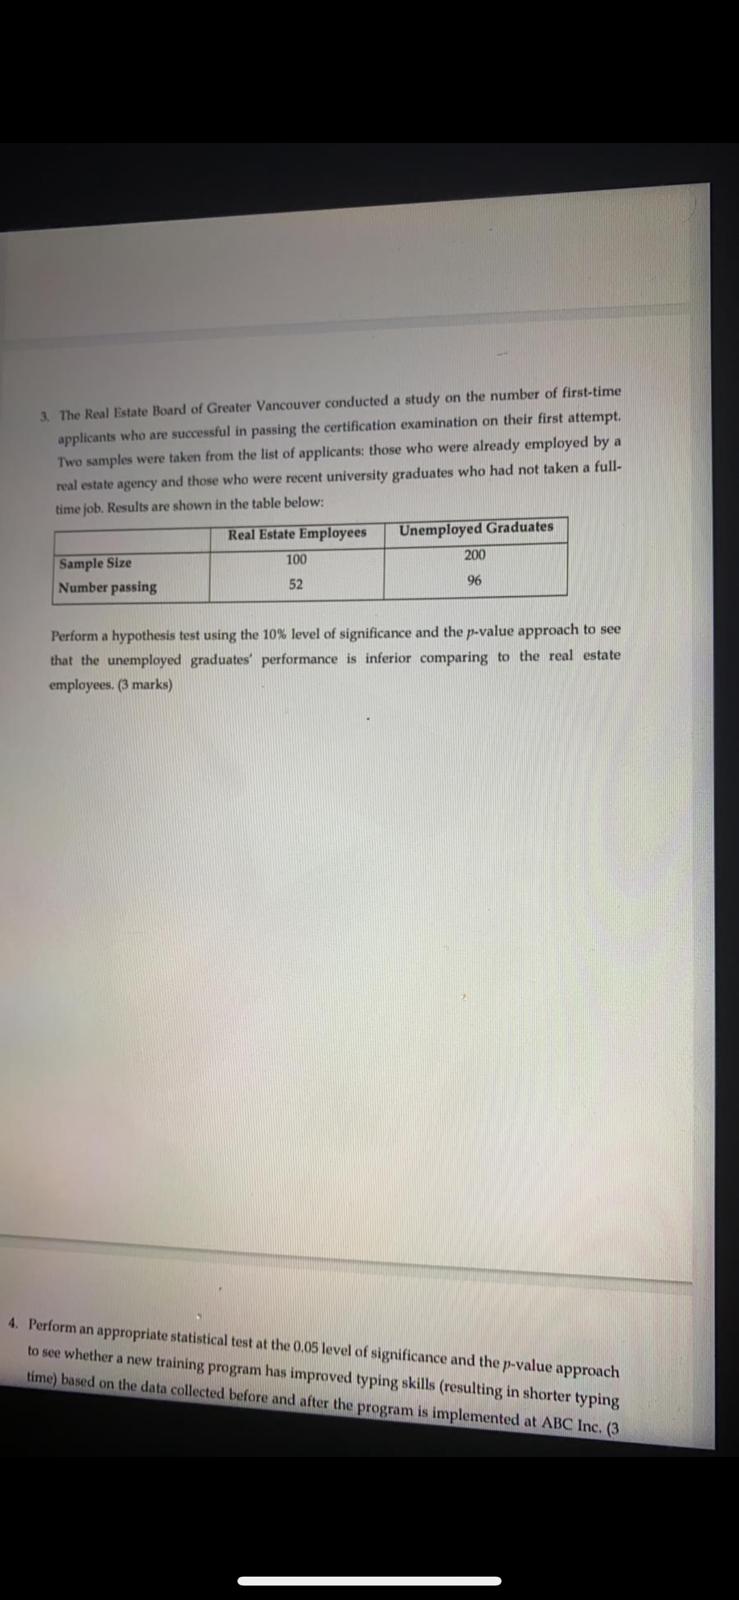
Please answer the follow screen images containing the questions for practise! With complete steps on each solution.
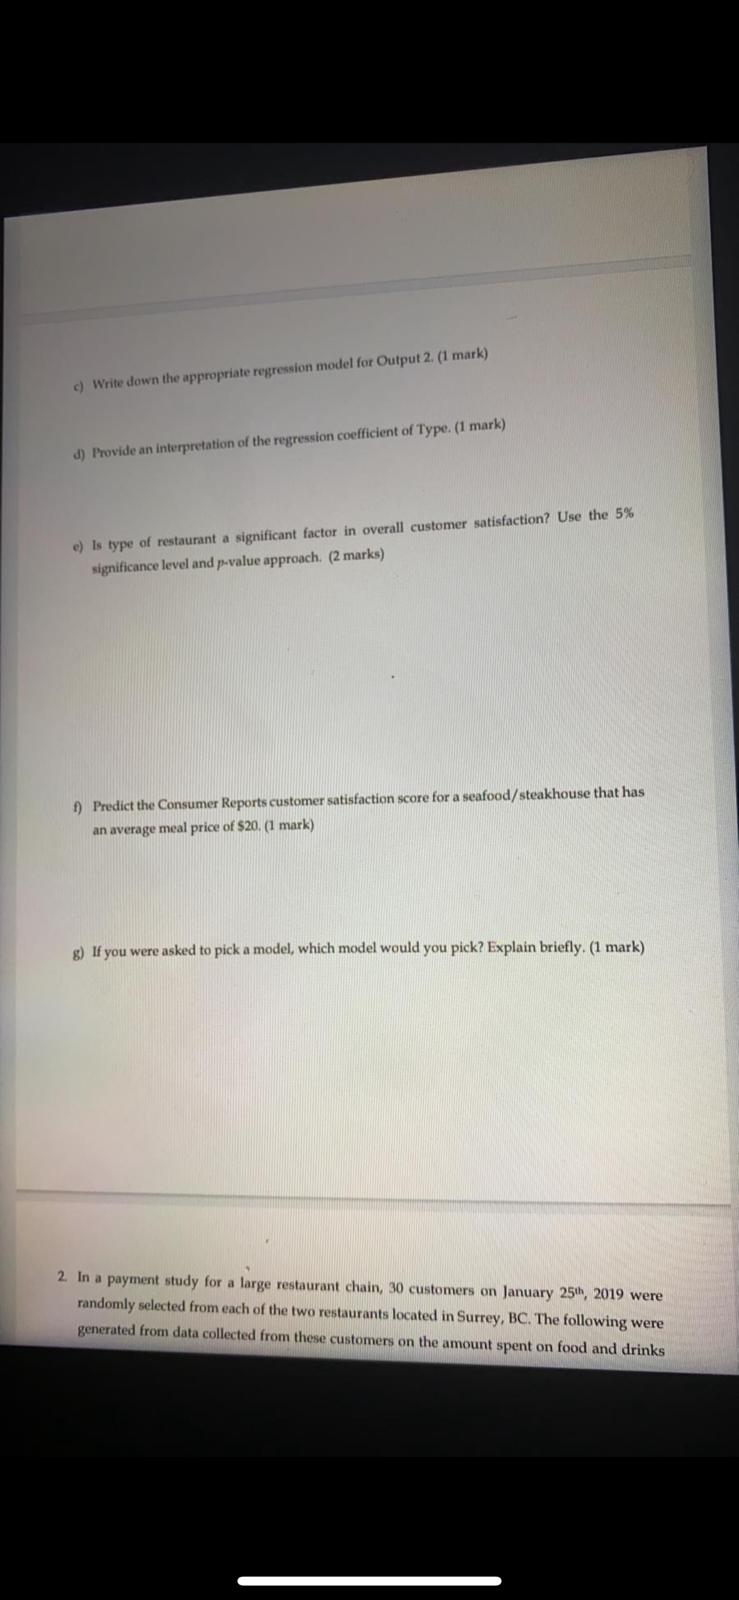
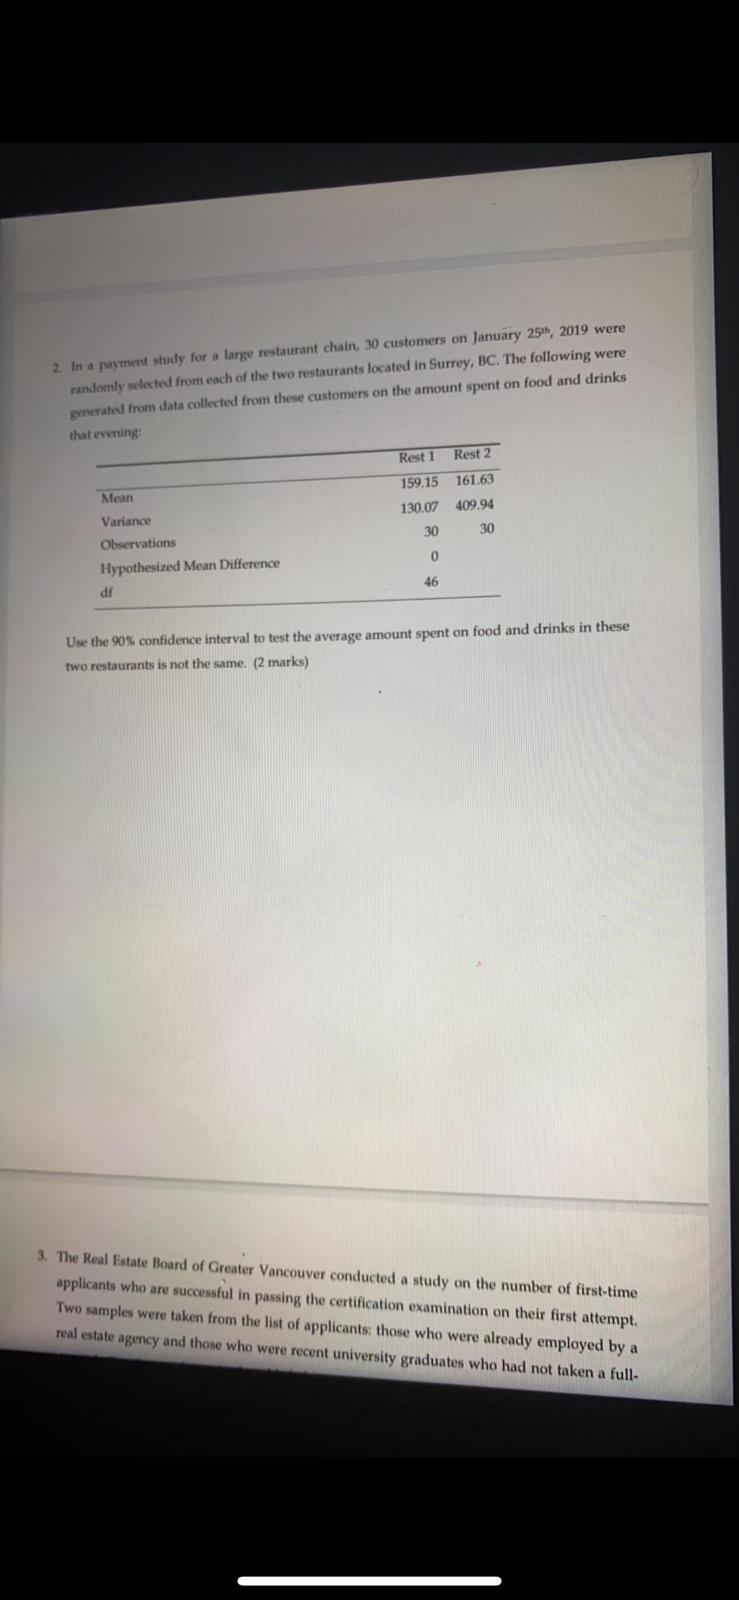
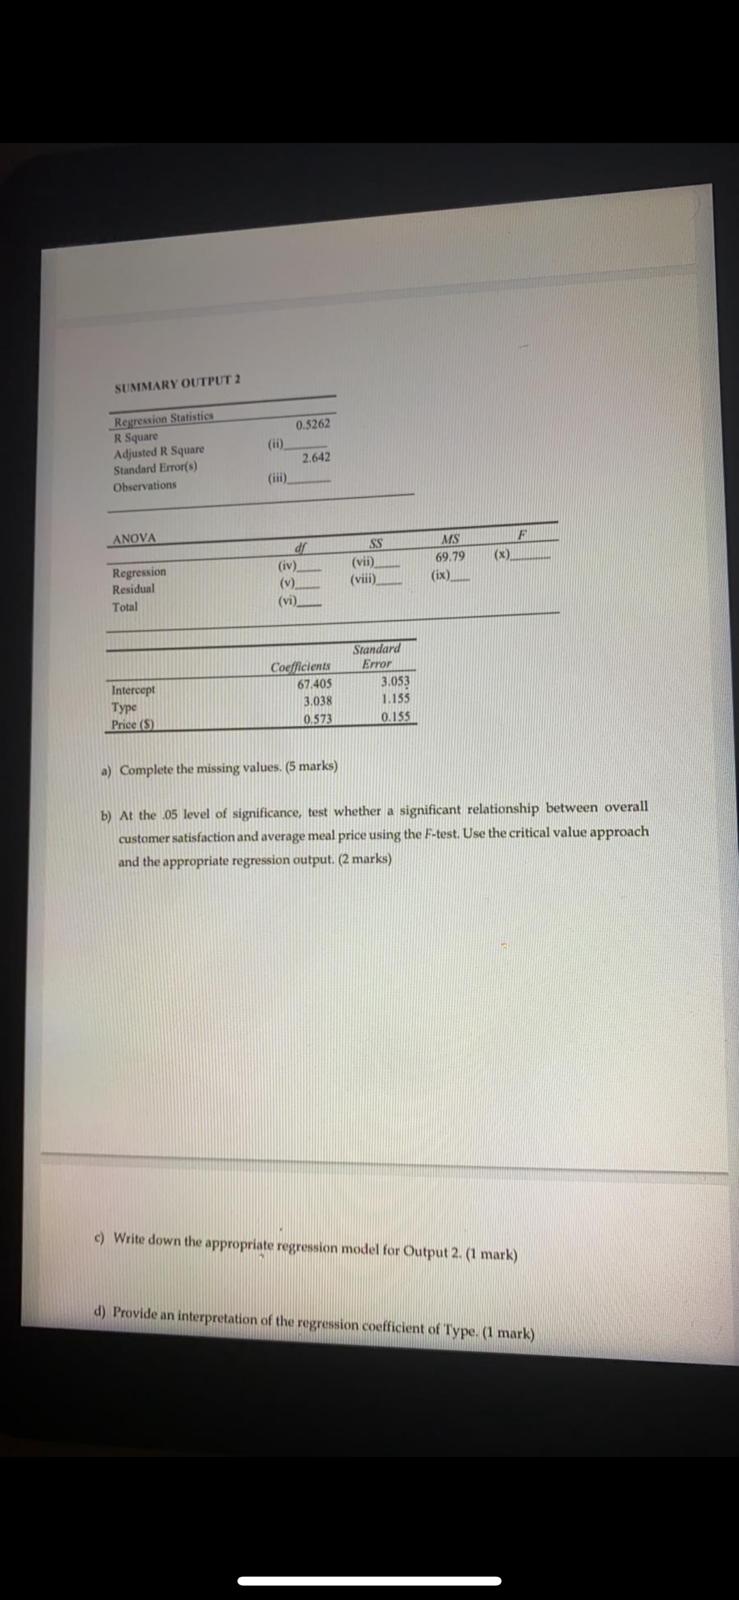
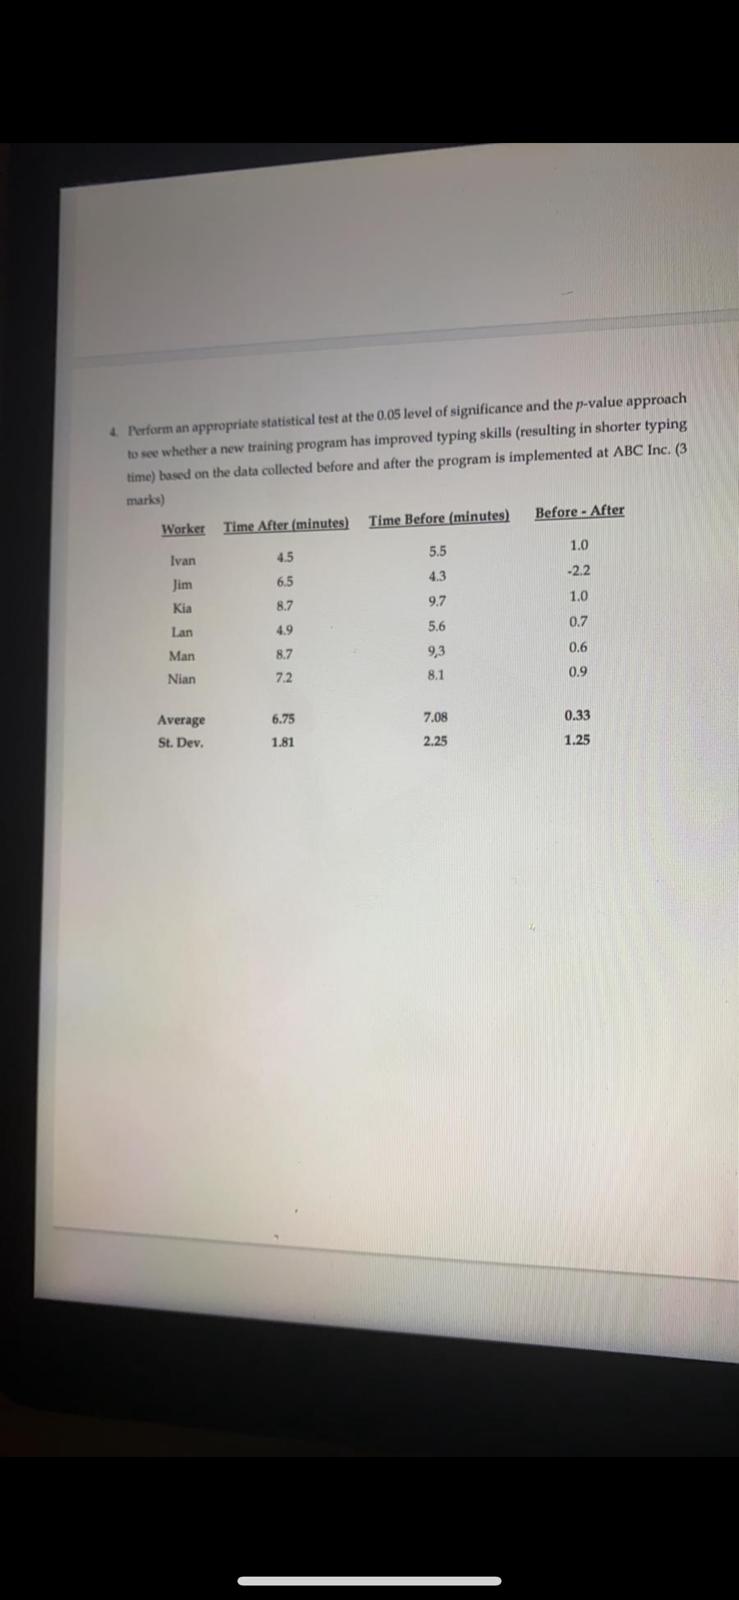
c) Write down the appropriate regression model for Output 2. (1 mark) d) Provide an interpretation of the regression coefficient of Type. (1 mark) e) Is type of restaurant a significant factor in overall customer satisfaction? Use the 5% significance level and p-value approach. (2 marks) f) Predict the Consumer Reports customer satisfaction score for a seafood/ steakhouse that has an average meal price of $20. (1 mark) g) If you were asked to pick a model, which model would you pick? Explain briefly. (1 mark) 2. In a payment study for a large restaurant chain, 30 customers on January 25th, 2019 were randomly selected from each of the two restaurants located in Surrey, BC. The following were generated from data collected from these customers on the amount spent on food and drinks2. In a payment study for a large restaurant chain, 30 customers on January 25, 2019 were randomly selected from each of the two restaurants located in Surrey, BC. The following were generated from data collected from these customers on the amount spent on food and drinks that evening: Rest 1 Rest 2 Mean 159.15 161.63 Variance 130.07 409.94 Observations 30 30 Hypothesized Mean Difference 0 JP 46 Use the 90% confidence interval to test the average amount spent on food and drinks in these two restaurants is not the same. (2 marks) 3. The Real Estate Board of Greater Vancouver conducted a study on the number of first-time applicants who are successful in passing the certification examination on their first attempt. Two samples were taken from the list of applicants: those who were already employed by a real estate agency and those who were recent university graduates who had not taken a full-SUMMARY OUTPUT 2 Regression Statistics R Square 0.5262 Adjusted R Square Standard Error(s) 2.642 Observations (iii) ANOVA SS Regression (iv) (vij) 59.79 (x) Residual (v)_ (vili) (ix) Total (vi) Standard Coefficients Error Intercept 67.405 3.053 Type 3,038 1.15 Price (S) 0.573 0.155 a) Complete the missing values. (5 marks) b) At the .05 level of significance, test whether a significant relationship between overall customer satisfaction and average meal price using the F-test. Use the critical value approach and the appropriate regression output. (2 marks) c) Write down the appropriate regression model for Output 2. (1 mark) d) Provide an interpretation of the regression coefficient of Type. (1 mark)4. Perform an appropriate statistical test at the 0.05 level of significance and the p-value approach to see whether a new training program has improved typing skills (resulting in shorter typing time) based on the data collected before and after the program is implemented at ABC Inc. (3 marks) Worker Time After (minutes) Time Before (minutes) Before - After Ivan 4.5 5.5 1.0 Jim 65 4.3 -2.2 Kia 8.7 9.7 1.0 Lan 4.9 5.6 0.7 Man 8.7 9,3 0.6 Nian 7.2 8.1 0.9 Average 6.75 7.08 0.33 St. Dev. 1.81 2.25 1.253, The Real Estate Board of Greater Vancouver conducted a study on the number of first-time applicants who are successful in passing the certification examination on their first attempt. Two samples were taken from the list of applicants: those who were already employed by a real estate agency and those who were recent university graduates who had not taken a full- time job. Results are shown in the table below: Real Estate Employees Unemployed Graduates Sample Size 100 200 Number passing 52 96 Perform a hypothesis test using the 10% level of significance and the p-value approach to see that the unemployed graduates' performance is inferior comparing to the real estate employees. (3 marks) 4. Perform an appropriate statistical test at the 0.05 level of significance and the p-value approach to see whether a new training program has improved typing skills (resulting in shorter typing time) based on the data collected before and after the program is implemented at ABC Inc. (3
