Answered step by step
Verified Expert Solution
Question
1 Approved Answer
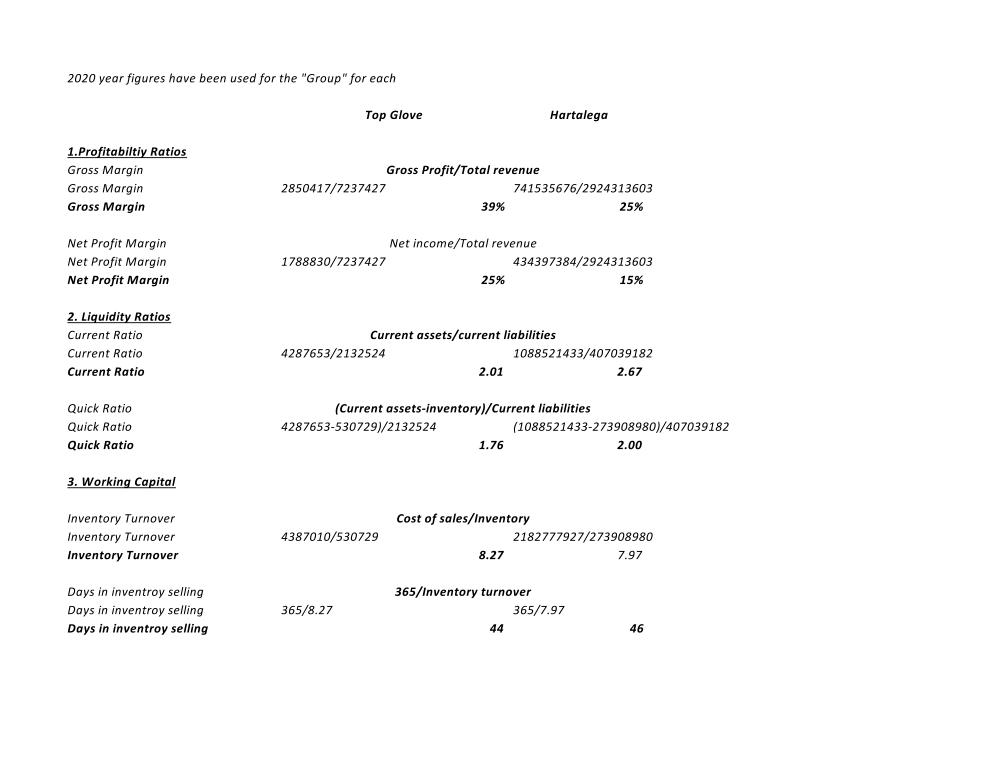
Please answer the following questions accordingly by referring to the table provided below, 1) Analyze and interpret the calculated financial ratio only for part 3
Please answer the following questions accordingly by referring to the table provided below,
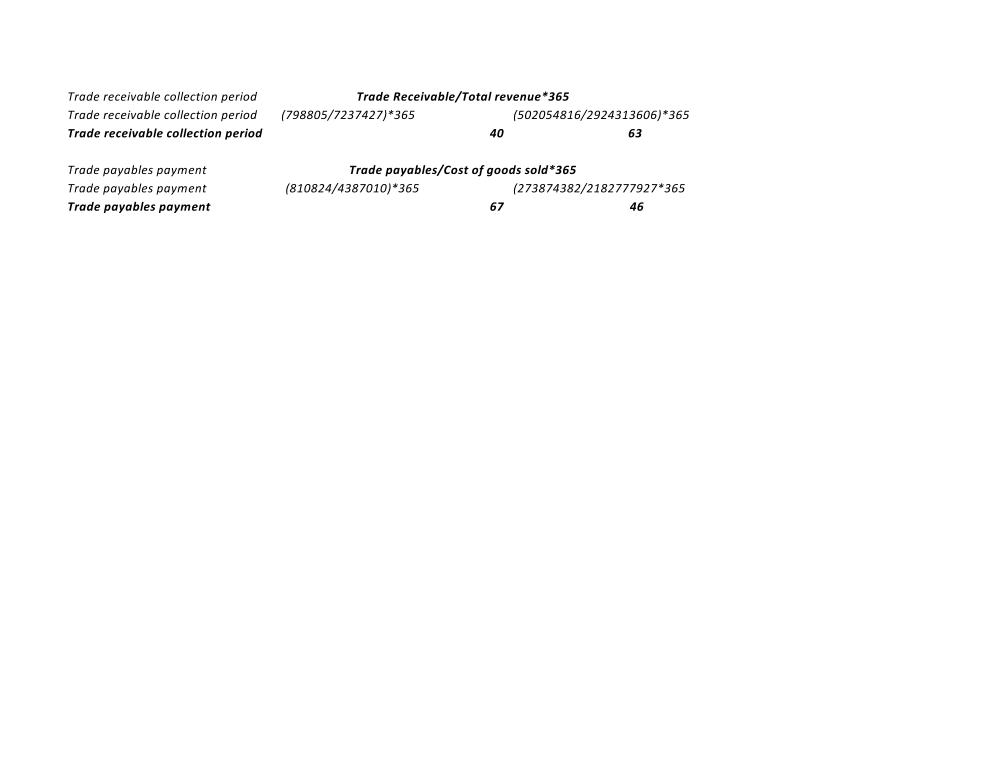
1) Analyze and interpret the calculated financial ratio only for part 3 which is the Working Capital Ratio of Top Glove and Hartalega in 2020.
2) Recommend which company (Top Glove or Hartalega) should Salam Berhad invest in with proper justification based on the Working Capital Ratio.


2020 year figures have been used for the "Group" for each Top Glove Hartalega 1.Profitabiltiy Ratios Gross Margin Gross Profit/Total revenue Gross Margin 2850417/7237427 741535676/2924313603 Gross Margin 39% 25% Net Profit Margin Net income/Total revenue Net Profit Margin Net Profit Margin 1788830/7237427 434397384/2924313603 25% 15% 2. Liquidity Ratios Current Ratio Current assets/current liabilities Current Ratio 4287653/2132524 1088521433/407039182 Current Ratio 2.01 2.67 Quick Ratio (Current assets-inventory)/Current liabilities Quick Ratio 4287653-530729)/2132524 (1088521433-273908980)/407039182 Quick Ratio 1.76 2.00 3. Working Capital Inventory Turnover Cost of sales/Inventory Inventory Turnover 4387010/530729 2182777927/273908980 Inventory Turnover 8.27 7.97 Days in inventroy selling 365/Inventory turnover Days in inventroy selling Days in inventroy selling 365/8.27 365/7.97 44 46
Step by Step Solution
★★★★★
3.51 Rating (164 Votes )
There are 3 Steps involved in it
Step: 1
Based on the working capital ratios we should invest in Top Glove Stepbystep explanation Question 1 3 Working Capital raitos Top Glove Haralega Invent...
Get Instant Access to Expert-Tailored Solutions
See step-by-step solutions with expert insights and AI powered tools for academic success
Step: 2

Step: 3

Ace Your Homework with AI
Get the answers you need in no time with our AI-driven, step-by-step assistance
Get Started


