Please answer the following questions all the information is included data graphs etc
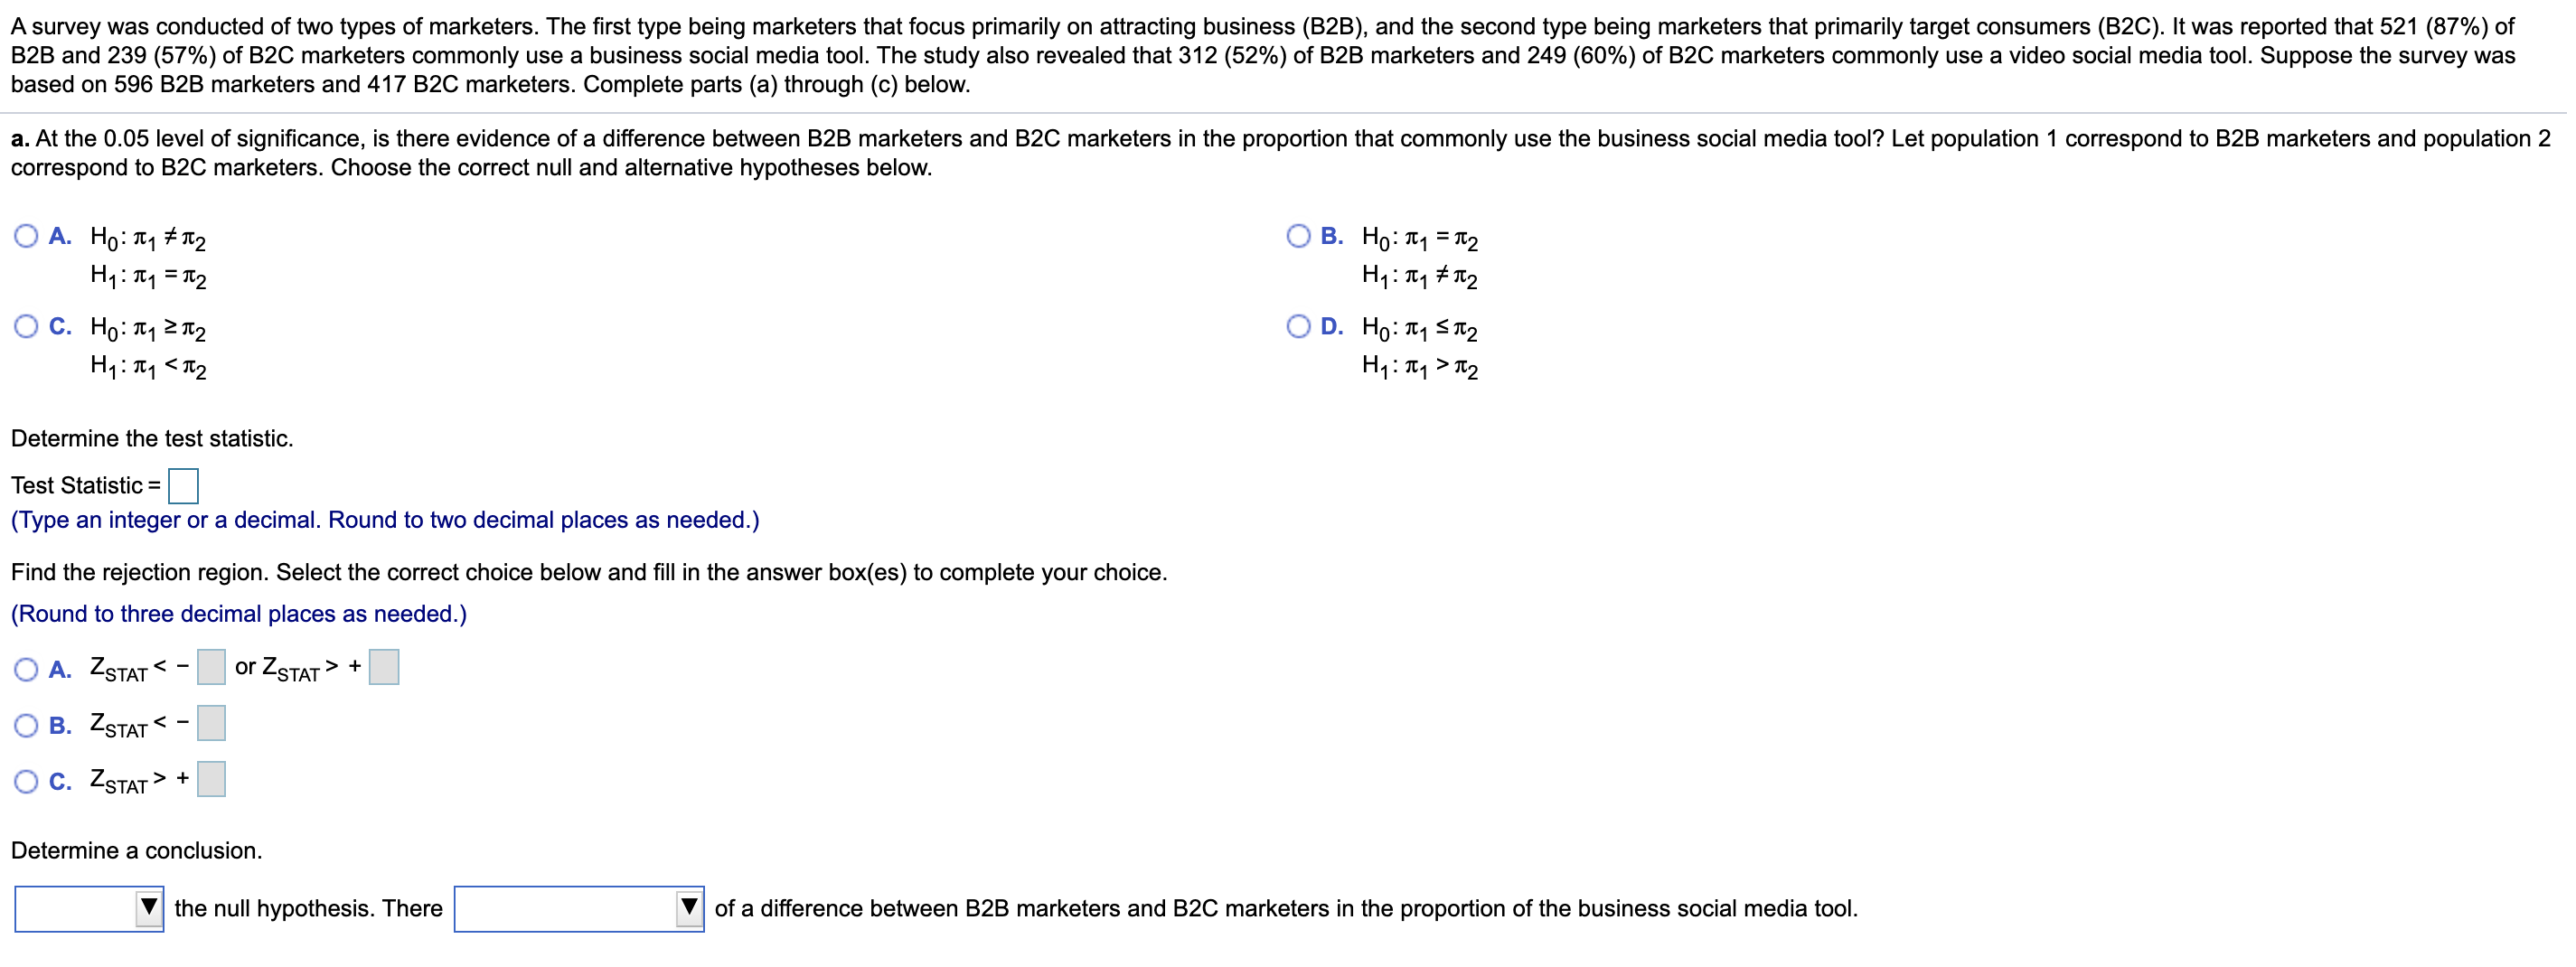
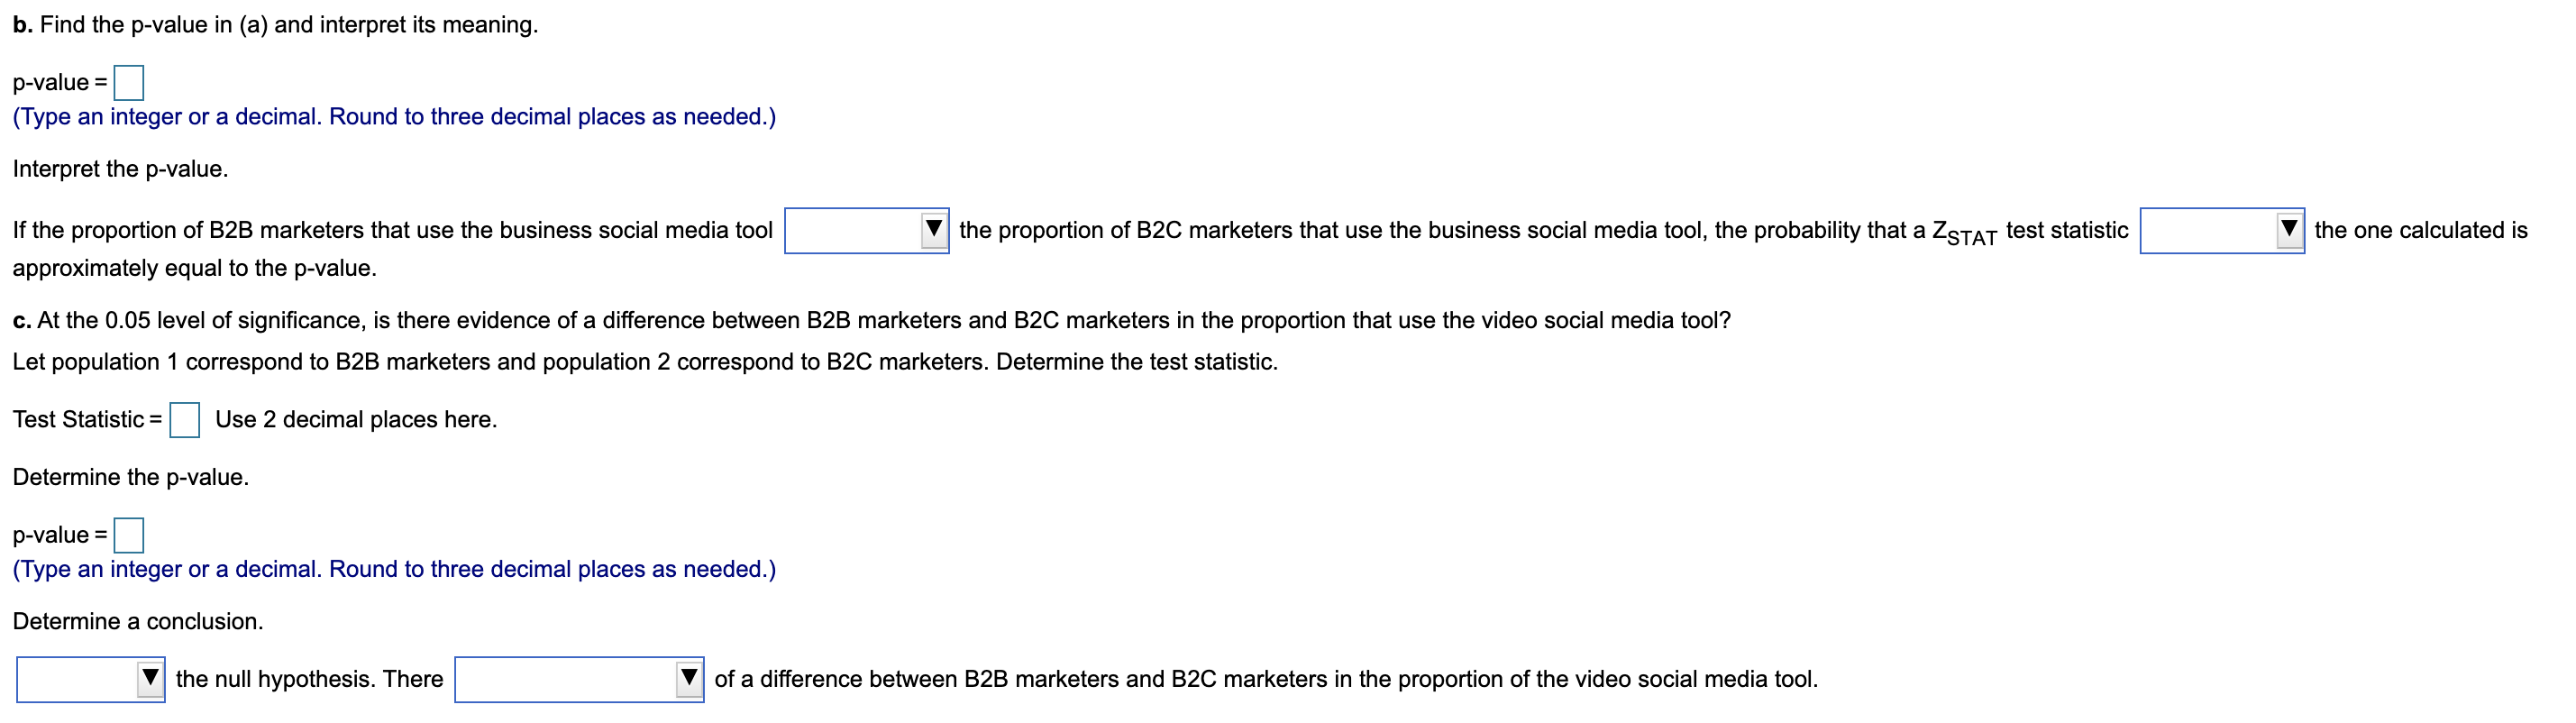
A survey was conducted of two types of marketers. The first type being marketers that focus primarily on attracting business (B2B), and the second type being marketers that primarily target consumers (B2C). It was reported that 521 (87%) of B2B and 239 (57%) of B2C marketers commonly use a business social media tool. The study also revealed that 312 (52%) of B2B marketers and 249 (60%) of B2C marketers commonly use a video social media tool. Suppose the survey was based on 596 B2B marketers and 417 B2C marketers. Complete parts (a) through (c) below. a. At the 0.05 level of significance, is there evidence of a difference between B2B marketers and B2C marketers in the proportion that commonly use the business social media tool? Let population 1 correspond to B2B marketers and population 2 correspond to B2C marketers. Choose the correct null and alternative hypotheses below. O A. HO: T1 # 12 O B. HO: T1 = 12 H1 : 101 = 1 2 H1: 141 # 16 2 O C. HO: T1 2 12 OD. HO: T1 ST2 H1 : 1 1 1 2 Determine the test statistic. Test Statistic = (Type an integer or a decimal. Round to two decimal places as needed.) Find the rejection region. Select the correct choice below and fill in the answer box(es) to complete your choice. 'Round to three decimal places as needed.) O A. ZSTAT + O B. ZSTAT + Determine a conclusion. the null hypothesis. There of a difference between B2B marketers and B2C marketers in the proportion of the business social media tool.b. Find the p-value in (a) and interpret its meaning. p-value = (Type an integer or a decimal. Round to three decimal places as needed.) Interpret the p-value. If the proportion of B2B marketers that use the business social media tool approximately equal to the p-value. 7 the proportion of 826 marketers that use the business social media tool, the probability that a ZSTAT test statistic c. At the 0.05 level of signicance, is there evidence of a difference between 323 marketers and 320 marketers in the proportion that use the video social media tool? Let population 1 correspond to 323 marketers and population 2 correspond to 32C marketers. Determine the test statistic. Test Statistic = Use 2 decimal places here. Determine the p-value. p-value = (Type an integer or a decimal. Round to three decimal places as needed.) Determine a conclusion. V the null hypothesis. There of a difference between B2B marketers and B20 marketers in the proportion of the video social media tool. l
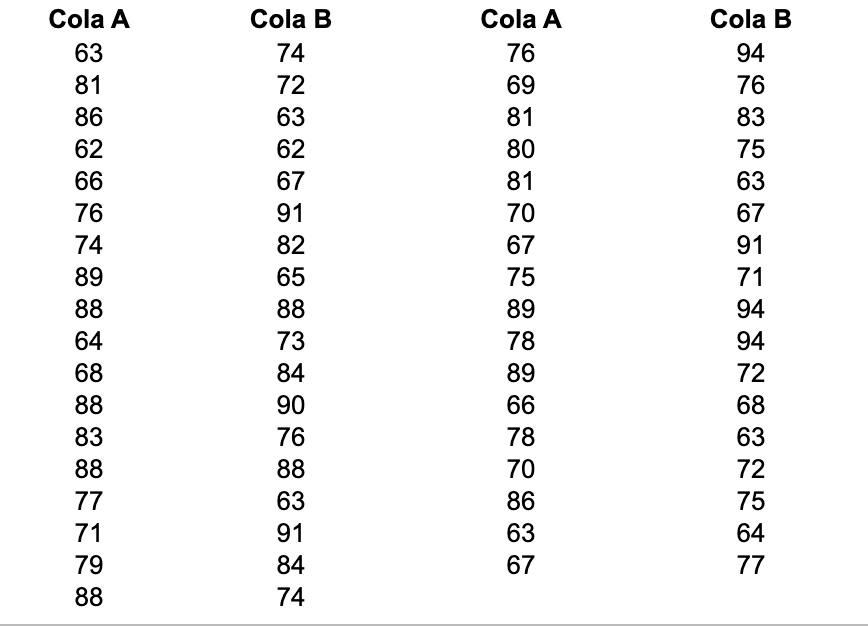
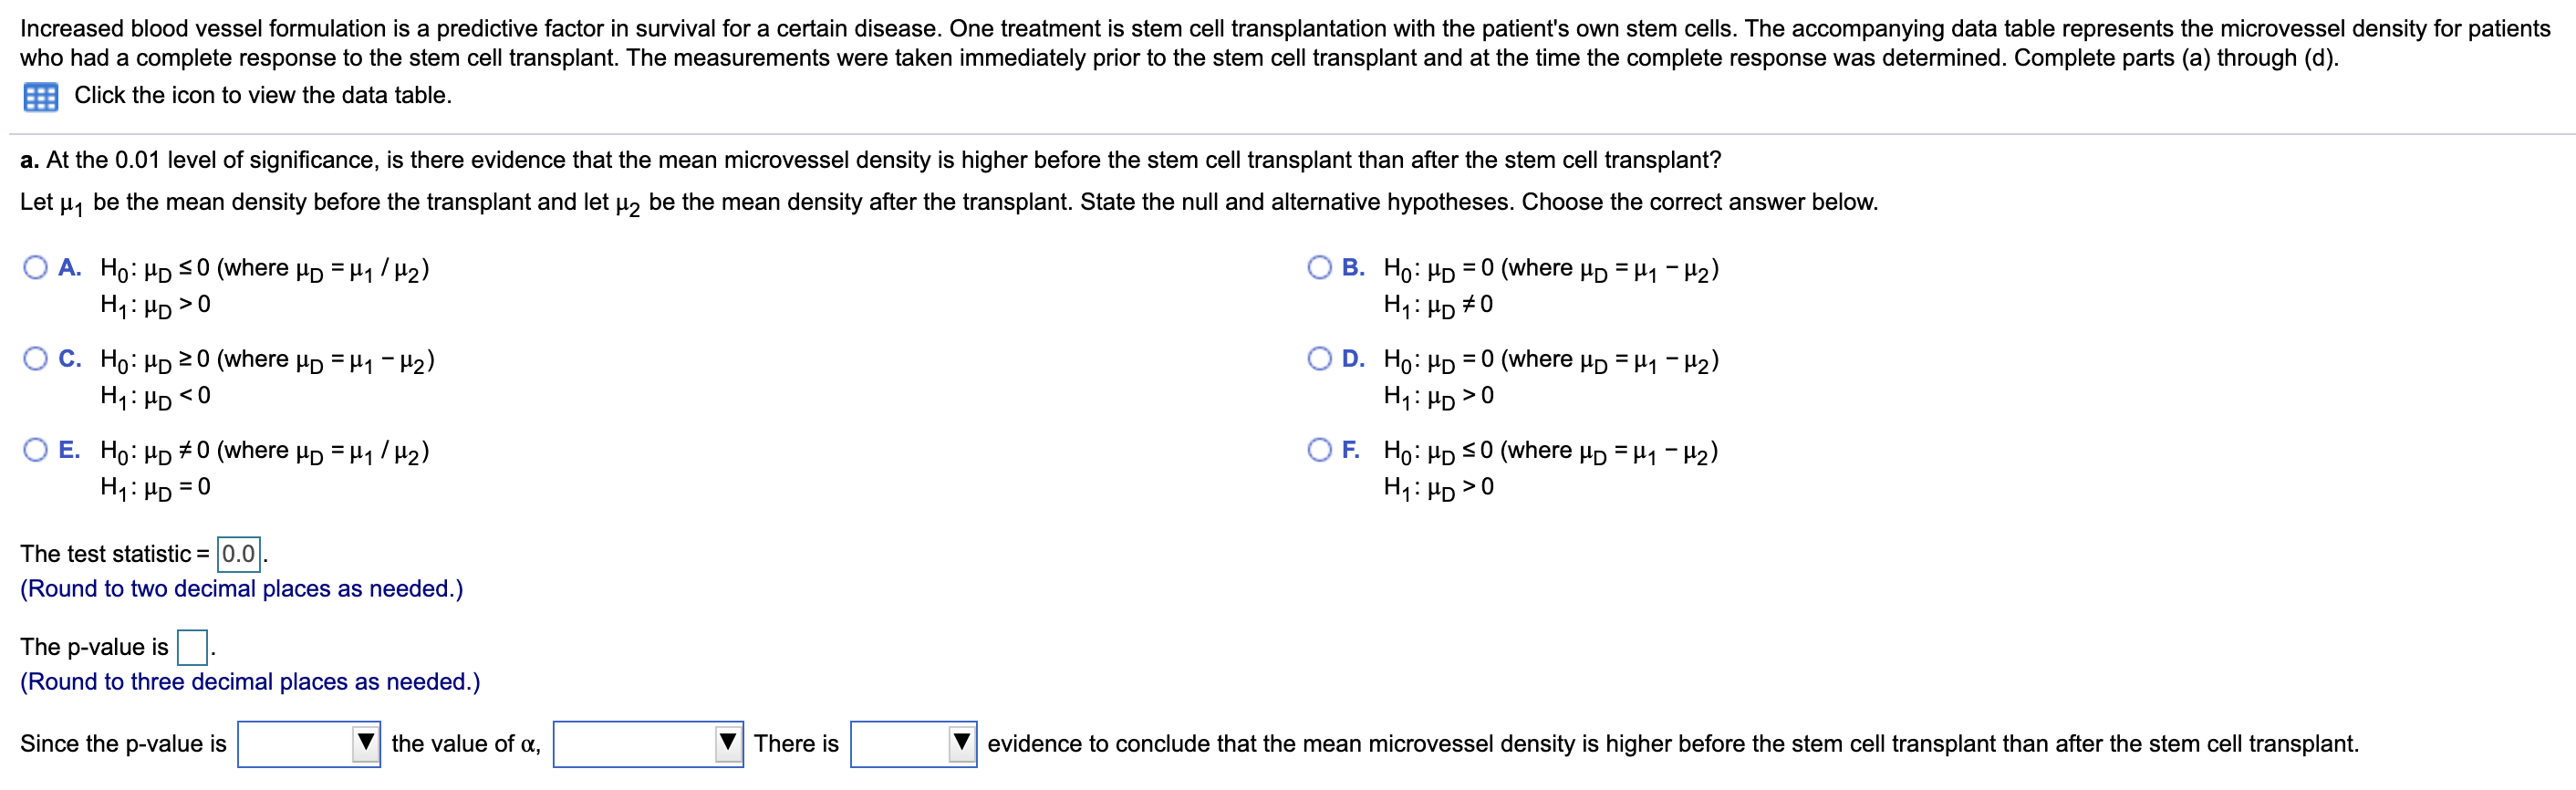
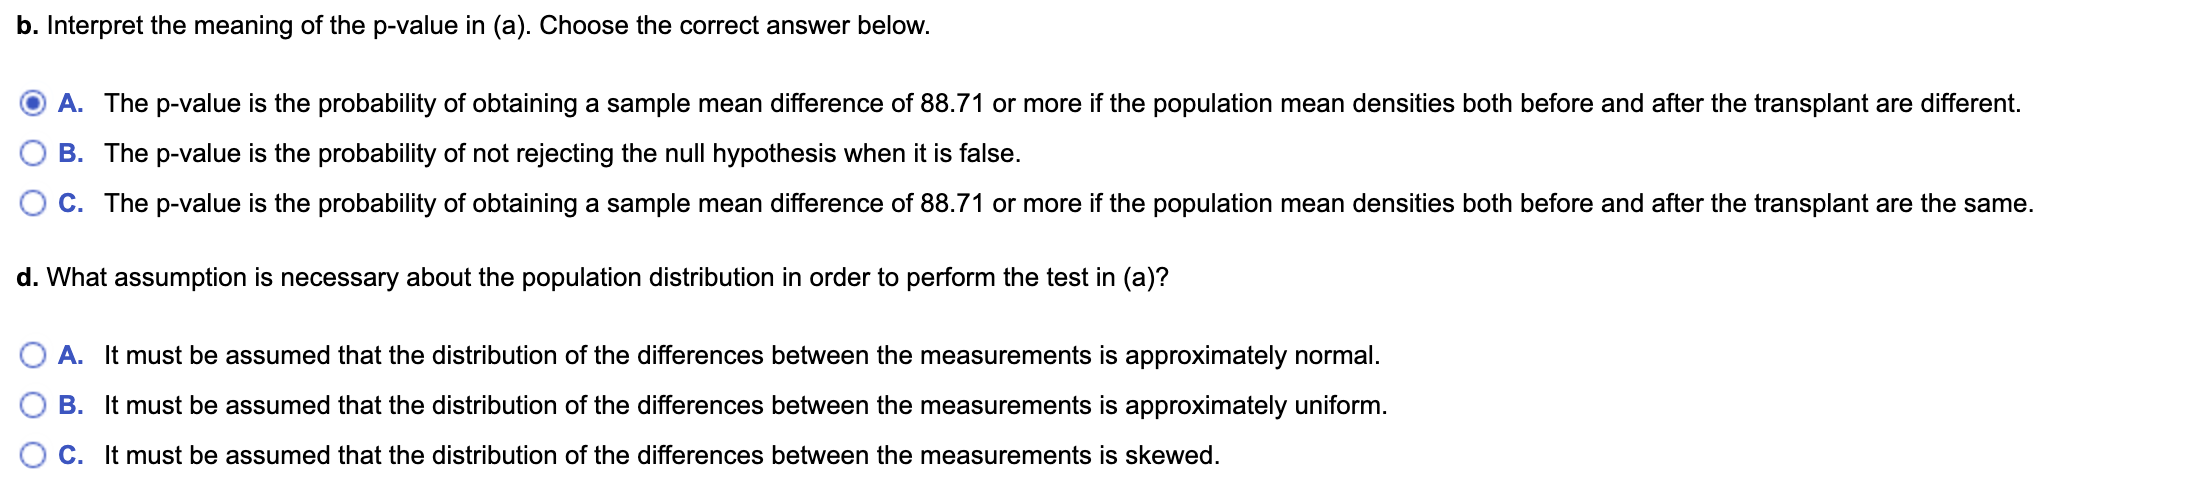
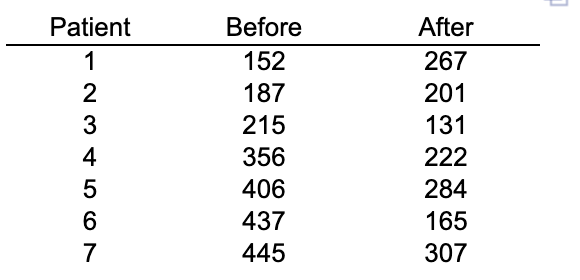
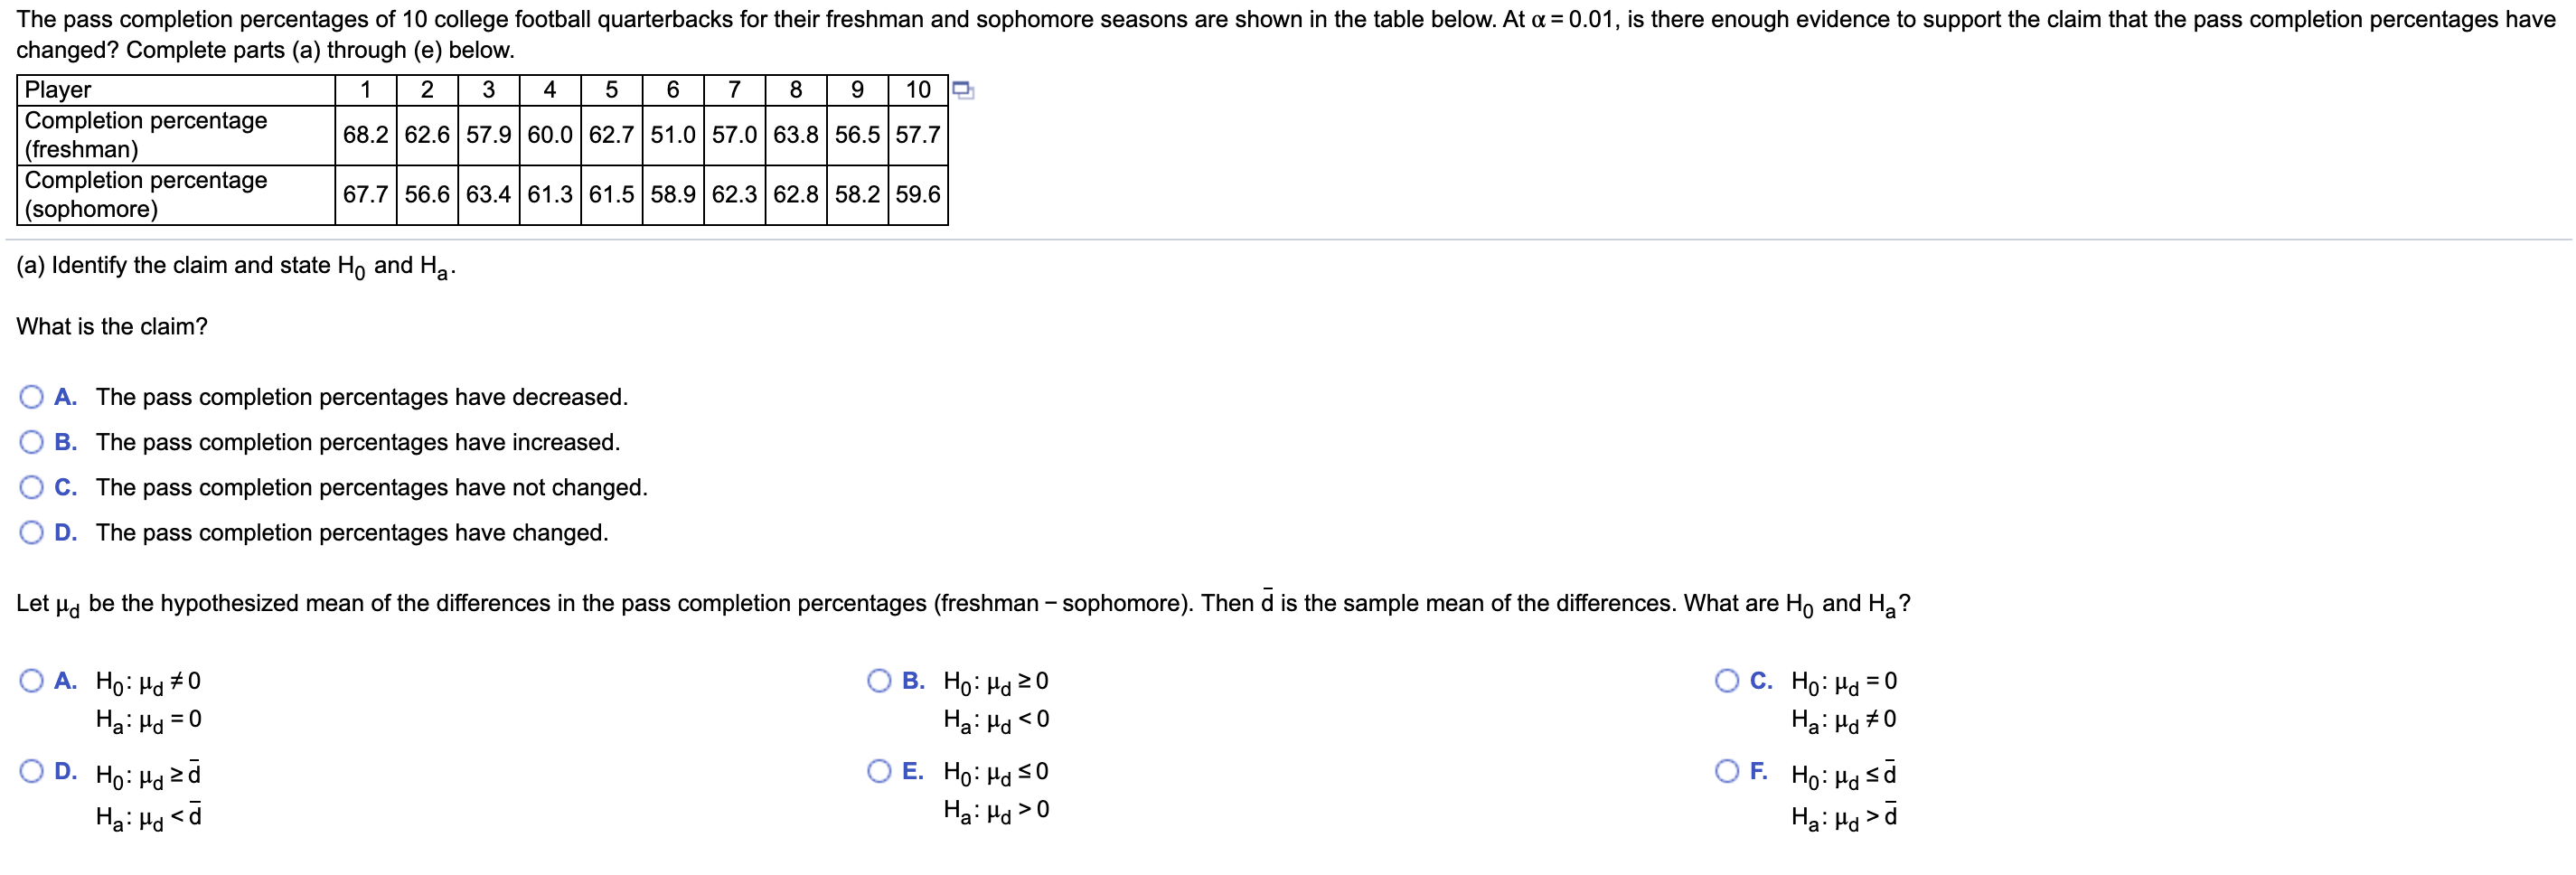
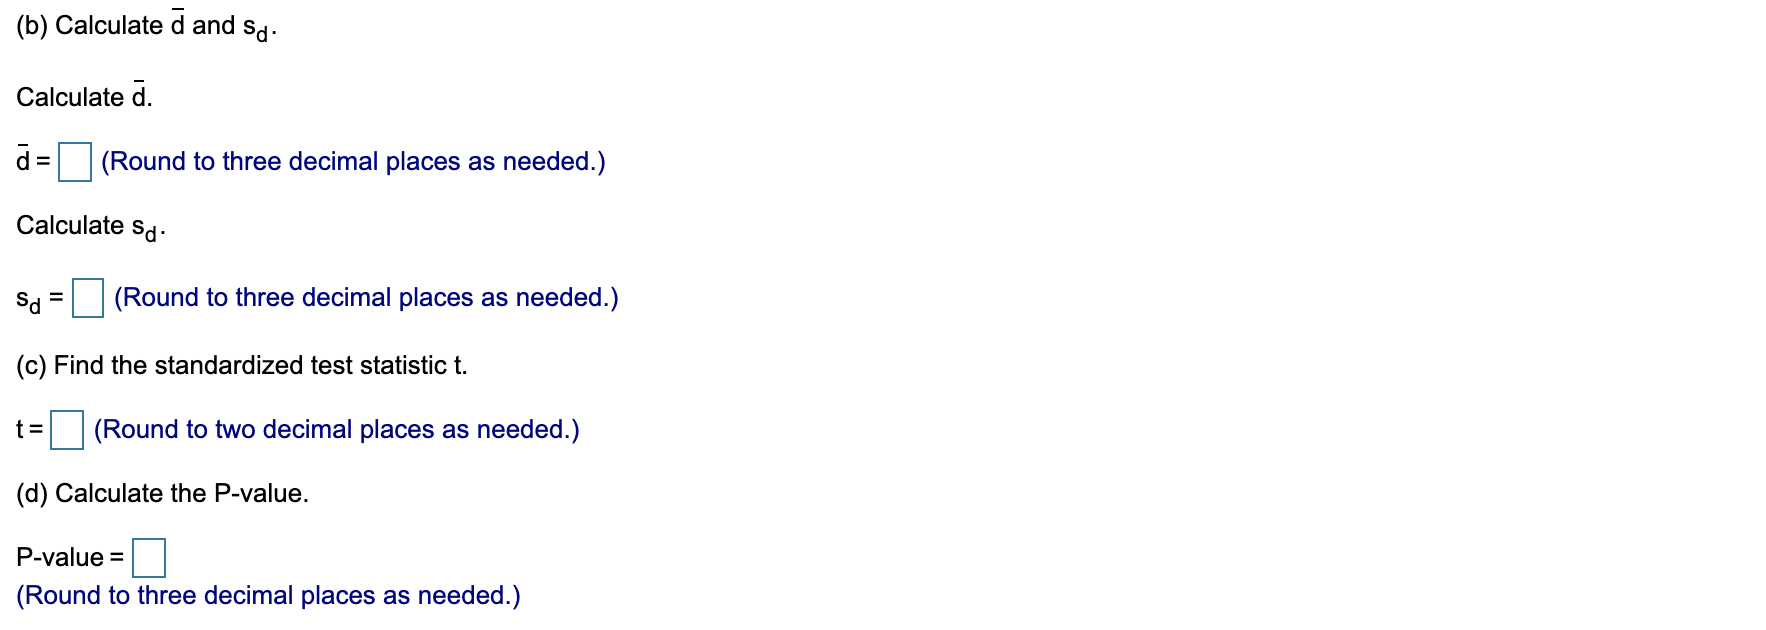
0 Oc. H0:PDO (wherepD=p1-p2) OD. H0:I'|D20 (wherepD=p1-p2) H13llo=0 H1:|"D 0 H1: HD # 0 O C. Ho: HD 20 (where HD = H1 - H2) OD. Ho: HD = 0 (where HD = M1 - H2) H1 : HD 0 O E. Ho: HD # 0 (where HD = H1 / H2) OF. Ho: HD SO (where HD = M1 - H2) H1 : HD = 0 H 1 : HD > 0 The test statistic = 0.0. (Round to two decimal places as needed.) The p-value is. (Round to three decimal places as needed.) Since the p-value is the value of a, There is evidence to conclude that the mean microvessel density is higher before the stem cell transplant than after the stem cell transplant.b. Interpret the meaning of the p-value in (a). Choose the correct answer below. A. The p-value is the probability of obtaining a sample mean difference of 88.71 or more if the population mean densities both before and after the transplant are different. 0 B. The p-value is the probability of not rejecting the null hypothesis when it is false. 0 C. The p-value is the probability of obtaining a sample mean difference of 88.71 or more if the population mean densities both before and after the transplant are the same. d. What assumption is necessary about the population distribution in order to perform the test in (a)? O A. It must be assumed that the distribution of the differences between the measurements is approximately normal. 0 B. It must be assumed that the distribution of the differences between the measurements is approximately uniform. O C. It must be assumed that the distribution of the differences between the measurements is skewed. \fThe pass completion percentages of 10 college football quarterbacks for their freshman and sophomore seasons are shown in the table below. At a = 0.01, is there enough evidence to support the claim that the pass completion percentages have changed? Complete parts (a) through (e) below. Player 1 2 3 4 5 6 7 8 9 10 Completion percentage (freshman) 68.2 62.6 57.9 60.0 62.7 51.0 57.0 63.8 56.5 57.7 Completion percentage (sophomore) 67.7 56.6 63.4 61.3 61.5 58.9 62.3 62.8 58.2 59.6 (a) Identify the claim and state Ho and Ha- What is the claim? O A. The pass completion percentages have decreased. O B. The pass completion percentages have increased. O C. The pass completion percentages have not changed. O D. The pass completion percentages have changed. Let Ha be the hypothesized mean of the differences in the pass completion percentages (freshman - sophomore). Then d is the sample mean of the differences. What are Ho and Ha? OA. Ho: Hd # 0 OB. Ho: Hd 20 O C. Ho: Hd = 0 Ha: Hd = 0 Ha: Hd 0 Ha: Hd > d(b) Calculate a and ed. Calculate a. d= El (Round to three decimal places as needed.) Calculate sd. sd = I: (Round to three decimal places as needed.) (c) Find the standardized test statistic t. 1: D (Round to two decimal places as needed.) (d) Calculate the P-value. P-value = Cl (Round to three decimal places as needed.) (e) The rejection regions for this test would be t 3.250, so the null hypothesis would not be rejected. Decide whether to reject or fail to reject the null hypothesis using the P-value. Interpret the decision in the context of the original claim, Are the results the same as the critical value approach? V the results ll the same as using the critical value approach Click to select your answer(s) and then click Check Answer. V the null hypothesis. There Reject l enough evidence to the claim that the pass completion percentages have [