

Question
Please answer the following questions pulling from the balance and income sheet provided. - Is Big W's Average Age of Accounts Payable good, bad or
Please answer the following questions pulling from the balance and income sheet provided.
- Is Big W's Average Age of Accounts Payable good, bad or average and what would the days show about their business?
- Is Big W's General Overhead Ratio good, bad or average and what would the ratio show about their business?
-Is Big W's Collection period w/o retention good, bad or average and what would the days show about their business?
- What is the Return on Equity for Big W Construction for the Current year?
- What is the Return on Assets for Big W Construction for the Current year?
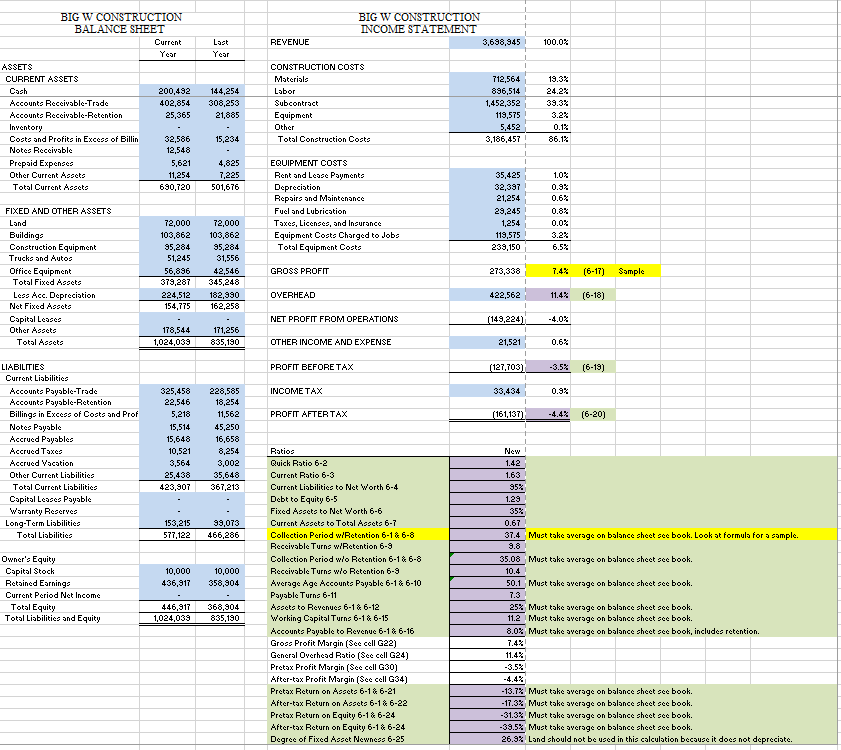
BIG W CONSTRUCTION INCOME STATEMENT 3,698,945 REVENUE 100.0% Last Year BIG W CONSTRUCTION BALANCE SHEET Current Year ASSETS CURRENT ASSETS Cash 200,492 Accounts Receivable-Trade 402,854 Accounts Receivable-Retention 25,365 Inventory Costs and Profits in Excess of Billin 32,586 Notes Receivable 12,548 Prepaid Expenses 5,621 Other Current Assets 11,254 Total Current Assets 690,720 144,254 308,253 21,885 CONSTRUCTION COSTS Materials Labor Subcontract Equipment Other Total Construction Costs 712,564 896,514 1,452,352 119,575 5,452 3,186,457 19.3% 24.2% 39.3% 3.2% 0.1% 86.13 15,234 4,825 7,225 501,676 EQUIPMENT COSTS Rent and Lease Payments Depreciation Repairs and Maintenance Fuel and Lubrication Taxes, Licenses, and Insurance Equipment Costs Charged to Jobs Total Equipment Costs 35,425 32,397 21,254 29,245 1,254 119,575 239,150 1.0% 0.9% 0.6% 0.8% 0.0% 3.2% 6.5% 72,000 103,862 95,284 51,245 56,896 379,287 224,512 154,775 72,000 103,862 95,284 31,556 42,546 345,248 182,930 162,258 GROSS PROFIT 273,338 FIXED AND OTHER ASSETS Land Buildings Construction Equipment Trucks and Autos Office Equipment Total Fixed Assets Less Acc. Depreciation Net Fixed Assets Capital Lopes Other Assets Total Asseto 7.4% (6-17) Sample OVERHEAD 422,562 11.4% (6-18) NET PROFIT FROM OPERATIONS (149,224) -4.03 178,544 1,024,039 171,256 835,190 OTHER INCOME AND EXPENSE 21,521 0.6% PROFIT BEFORE TAX (127,703) -3.5% (6-13) INCOME TAX 33,434 0.9% PROFIT AFTER TAX (161,137) (6-20) LIABILITIES Current Liabilities Accounts Payable-Trade Accounts Payable-Retention Billings in Excess of Costo and Prof Notes Payable Accrued Payables Accrued Taxes Accrued Vacation Other Current Liabilities Total Current Liabilities Capital Leases Payable Warranty Reserved Long-Term Liabilities Total Liabilitics 325,458 22,546 5,218 15,514 15,648 10,521 3,564 25,438 423,907 228,585 18,254 11,562 45,250 16,658 8,254 3,002 35,648 367,213 New 1.42 1.63 95% 1.29 35% 0.67 37.4 Must take average on balance sheet see book. Look at formula for a sample. 153,215 577,122 99,073 466,286 Owner's Equity Capital Stock Retained Earnings Current Period Net Income Total Equity Total Liabilities and Equity 10,000 436,917 10,000 358,304 Ratios Quick Ratio 6-2 Current Ratio 6-3 Current Liabilities to Net Worth 6-4 Debt to Equity 6-5 Fixed Assets to Net Worth 6-6 Current Assets to Total Assets 6-7 Collection Period w/Retention 6-1 & 6-8 Receivable Turns w/Retention 6-9 Collection Period wio Retention 6-1 & 6-8 Receivable Turns wio Retention 6-9 Average Age Accounts Payable 6-1 & 6-10 Payable Turns 6-11 Assets to Revenues 6-1 & 6-12 Working Capital Turns 6-1 & 6-15 Accounts Payable to Revenue 6-146-16 Gross Profit Margin (84 call G22) General Overhead Ratio (Sec cell G24) Pretax Profit Margin (Sec cell G30) After-tax Profit Margin ($94 cell G34) Pretax Return on Assets 6-186-21 After-tax Return on Assets 6-1&6-22 Pretax Return on Equity 6-1&6-24 After-tax Return on Equity 6-186-24 Degree of Fixed Asset Newness 6-25 446,917 1,024,039 368,904 835,190 35.08 Must take average on balance sheet see book. 10.4 50.1 Must take average on balance sheet sec book. 7.3 25% Must take average on balance sheet sec book. 11.2 Must take average on balance sheet scebook. 8.0% Must take average on balance sheet sec book, includes retention. 7.4% 11.43 -3.5% -4.4% -13.7% Must take average on balance sheet scebook. -17.3% Must take average on balance sheet sec book. -31.3% Must take average on balance sheet see book. -39.5% Must take average on balance sheet see book. 26.9% Land should not be used in this calculation because it does not depreciate
Step by Step Solution
There are 3 Steps involved in it
Step: 1

Get Instant Access to Expert-Tailored Solutions
See step-by-step solutions with expert insights and AI powered tools for academic success
Step: 2

Step: 3
Ace Your Homework with AI
Get the answers you need in no time with our AI-driven, step-by-step assistance
Get Started
Financial Management Of Health Care Organizations
Authors: William N. Zelman, Michael J. McCue, Noah D. Glick, Marci S. Thomas
4th Edition
111846656X, 978-1118466568