

Question
Please answer the following using the attached file: 1) The expected return assuming that the past returns represent the expected future returns 2) Calculate the
Please answer the following using the attached file:
1) The expected return assuming that the past returns represent the expected future returns
2) Calculate the standard deviation of each portfolio
3) Calculate the expected return for a portfolio weight 50% in each security
4) Calculate the standard deviation of the portfolio from a combination of the two assets
5) Calculate the minimum variance portfolio for a combination of the two assets
6) Plot the efficient frontier including the minimum variance portfolio
7) Now assume there is a risk-free asset with a return of 3%.
a. Create the new efficient frontier
b. Identify the weights of the risky assets in the market portfolio
c. Assume an investor has a coefficient of relative risk aversion of 15. Find the investors optimal complete portfolio.
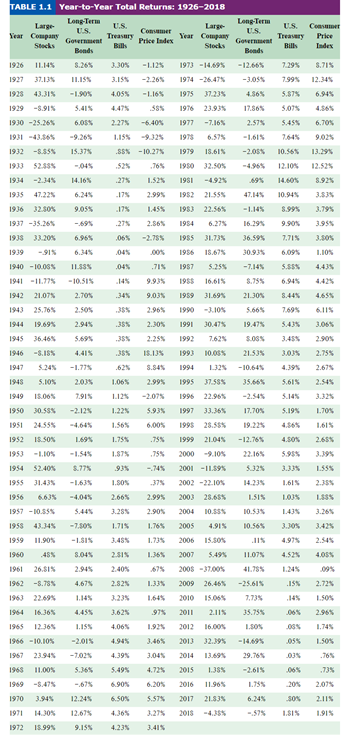
Consumer Price Index 7.39% 3.15 12.345 6.945 6.709 1975 9.02% 13.29% 12.52 1951 3.835 3.95% 3.50% LION .715 4.43 4425 4,65% 3.06% 20 2.755 TABLE 1.1 Year-to-Year Total Returns: 1926-2018 Long-Term U.S. Large Long-Term US US. Conet US Year Company Treasury Government Year Company Price Index Stocks Treasury Gorn Bills Bonds Stocks Bills Beads 1926 11145 3.30% -112 1973 -14.69% -12.66% 1927 37.13 11.15 3.18 -2.26% 1974 -26.47% -3.05% 7.99% 1923 43.31% -1.905 4,05% -1.16% 1975 37.235 4.86% 5.875 1929 -8.91% 5.41 .385 1976 23.93% 17.86% 5.07% 1930 -25.26% 2.27% -6.40 1977 -7.16 2.575 5.455 1931-43.36% 6.57% -1.61% 2645 1932 -8.355 15.37 .85% -10.27 1979 15.618 -2.05% 10.56% 1933 52.335 - 045 .525 1950 32.50% 12.10% 1934 14.16% -27% 1.52 -1.92 1935 47.225 6.249 2.99% 1982 21.55% 10.94% 1936 32.50% 9.05% .17% 1.45% 198) 22.56% -1.145 8.99% 1937 -35.26% .27% 2.865 1984 6.275 16.294 9.90 1938 33.209 6.965 065 -2.75% 1985 31.73% 36,59% 7.715 1939 -915 6.34% .045 ,00% 1956 18.67% 30.93% 6.09% 1940 -10.08 .045 1987 5.255 -7.145 5.55 1941 -11.775 - 10:51 .14% 9.93 1955 16,615 8.755 6.94% 1942 21.07% 2.705 9.03 1959 3169% 2130% 8.44% 1943 25.765 2.50% 2.965 1990-3.105 5.66% 7.69% 1944 19.69% 2.945 .35% 2.30% 1991 30.47% 19.47% 5.43% 1945 36.46% 5.695 2.25 1992 7.625 8.085 3.45 1946 -S.IS 18.13% 1993 10.05% 21.535 3.00 1947 5.24% -1.77% 8.845 1994 1325 -10.64% 5.10% 2,03% 1.06% 2.99% 1995 37.585 35.66% 5.615 1949 15.06% 7.915 112 -2.075 1996 22.96% 5.14% 1950 30.535 1.225 1997 33.365 17.70% 5.19% 1951 24.555 1.56% 6.00 1995 28.555 19.22% 1952 18.50% 1.69% 1.755 1999 21045 -12.765 4.50% 1953 -1.10% -1.545 1.87% .755 2000 -9.10% 22.16 5.955 1954 52.40% 8.77% 935 2001 -11.59% 5.32% 1955 31.435 -1.635 1.50 2002 -22.10% 14.23 1.618 1956 6,63% -4,04% 2.66% 2.99% 2003 28.65% 1.51% LOS 1957 -10.555 5.445 3.28% 2.905 2004 10.555 10.535 1958 43.345 1.715 1.76% 2005 4.915 10.56% 1959 11.90 -1.SIS 3.485 1.73% 2006 15.50% 4.97 1960 8.04% 2.515 2007 5.49% 11.07% 1961 26.SIS 2.94% 2.405 2005 - 37005 41.785 1.24% 1962 -8.78 4.67% 2.82 2009 26.46% -25.61 1963 22.69% 1.14% 3.23% 1.64% 2010 15.06% 7.73% 16.36% 3.625 978 2011 2.115 35.75 1965 L.IS 4.06% 1.92 2012 16.00% 1.SOS 1966 -10.10% -2.01% 4.94% 3.46% 2013 32.39% .05% 196723.945 -7025 4.39% 3.045 2014 13.69% 29.76% OS 1968 11.00% 5.36% 5.49% 4.725 2015 1.38% -2.615 1969 -67% 6.90% 6.205 2016 1.755 205 1970 3.945 12.24% 6.50% S.57% 2017 21.83 6.24% SO 1971 14.30% 12.67% 4.36% 3.275 2015 -57% 1.SIS 1972 18.99% 9.15 4.23% 2.67% 3.32% 5.933 1.70% 1,61% 2.65 3.39% 1.55% 2.72% 1.50% 2.965 1.74 1.50% .765 .735 2.07% 2.115 1.91% Consumer Price Index 7.39% 3.15 12.345 6.945 6.709 1975 9.02% 13.29% 12.52 1951 3.835 3.95% 3.50% LION .715 4.43 4425 4,65% 3.06% 20 2.755 TABLE 1.1 Year-to-Year Total Returns: 1926-2018 Long-Term U.S. Large Long-Term US US. Conet US Year Company Treasury Government Year Company Price Index Stocks Treasury Gorn Bills Bonds Stocks Bills Beads 1926 11145 3.30% -112 1973 -14.69% -12.66% 1927 37.13 11.15 3.18 -2.26% 1974 -26.47% -3.05% 7.99% 1923 43.31% -1.905 4,05% -1.16% 1975 37.235 4.86% 5.875 1929 -8.91% 5.41 .385 1976 23.93% 17.86% 5.07% 1930 -25.26% 2.27% -6.40 1977 -7.16 2.575 5.455 1931-43.36% 6.57% -1.61% 2645 1932 -8.355 15.37 .85% -10.27 1979 15.618 -2.05% 10.56% 1933 52.335 - 045 .525 1950 32.50% 12.10% 1934 14.16% -27% 1.52 -1.92 1935 47.225 6.249 2.99% 1982 21.55% 10.94% 1936 32.50% 9.05% .17% 1.45% 198) 22.56% -1.145 8.99% 1937 -35.26% .27% 2.865 1984 6.275 16.294 9.90 1938 33.209 6.965 065 -2.75% 1985 31.73% 36,59% 7.715 1939 -915 6.34% .045 ,00% 1956 18.67% 30.93% 6.09% 1940 -10.08 .045 1987 5.255 -7.145 5.55 1941 -11.775 - 10:51 .14% 9.93 1955 16,615 8.755 6.94% 1942 21.07% 2.705 9.03 1959 3169% 2130% 8.44% 1943 25.765 2.50% 2.965 1990-3.105 5.66% 7.69% 1944 19.69% 2.945 .35% 2.30% 1991 30.47% 19.47% 5.43% 1945 36.46% 5.695 2.25 1992 7.625 8.085 3.45 1946 -S.IS 18.13% 1993 10.05% 21.535 3.00 1947 5.24% -1.77% 8.845 1994 1325 -10.64% 5.10% 2,03% 1.06% 2.99% 1995 37.585 35.66% 5.615 1949 15.06% 7.915 112 -2.075 1996 22.96% 5.14% 1950 30.535 1.225 1997 33.365 17.70% 5.19% 1951 24.555 1.56% 6.00 1995 28.555 19.22% 1952 18.50% 1.69% 1.755 1999 21045 -12.765 4.50% 1953 -1.10% -1.545 1.87% .755 2000 -9.10% 22.16 5.955 1954 52.40% 8.77% 935 2001 -11.59% 5.32% 1955 31.435 -1.635 1.50 2002 -22.10% 14.23 1.618 1956 6,63% -4,04% 2.66% 2.99% 2003 28.65% 1.51% LOS 1957 -10.555 5.445 3.28% 2.905 2004 10.555 10.535 1958 43.345 1.715 1.76% 2005 4.915 10.56% 1959 11.90 -1.SIS 3.485 1.73% 2006 15.50% 4.97 1960 8.04% 2.515 2007 5.49% 11.07% 1961 26.SIS 2.94% 2.405 2005 - 37005 41.785 1.24% 1962 -8.78 4.67% 2.82 2009 26.46% -25.61 1963 22.69% 1.14% 3.23% 1.64% 2010 15.06% 7.73% 16.36% 3.625 978 2011 2.115 35.75 1965 L.IS 4.06% 1.92 2012 16.00% 1.SOS 1966 -10.10% -2.01% 4.94% 3.46% 2013 32.39% .05% 196723.945 -7025 4.39% 3.045 2014 13.69% 29.76% OS 1968 11.00% 5.36% 5.49% 4.725 2015 1.38% -2.615 1969 -67% 6.90% 6.205 2016 1.755 205 1970 3.945 12.24% 6.50% S.57% 2017 21.83 6.24% SO 1971 14.30% 12.67% 4.36% 3.275 2015 -57% 1.SIS 1972 18.99% 9.15 4.23% 2.67% 3.32% 5.933 1.70% 1,61% 2.65 3.39% 1.55% 2.72% 1.50% 2.965 1.74 1.50% .765 .735 2.07% 2.115 1.91%Step by Step Solution
There are 3 Steps involved in it
Step: 1

Get Instant Access to Expert-Tailored Solutions
See step-by-step solutions with expert insights and AI powered tools for academic success
Step: 2

Step: 3
Ace Your Homework with AI
Get the answers you need in no time with our AI-driven, step-by-step assistance
Get Started
Biblical Finance Reflections On Money Wealth And Possessions
Authors: Mark Lloydbottom, Keith Tondeur
1st Edition
0956395023, 978-0956395023