Answered step by step
Verified Expert Solution
Question
1 Approved Answer
Please answer these 2 questions - as per Chegg standard. Use python for the code and implement basic packages. Don't copy from other places. Make

Please answer these 2 questions - as per Chegg standard. Use python for the code and implement basic packages. Don't copy from other places.
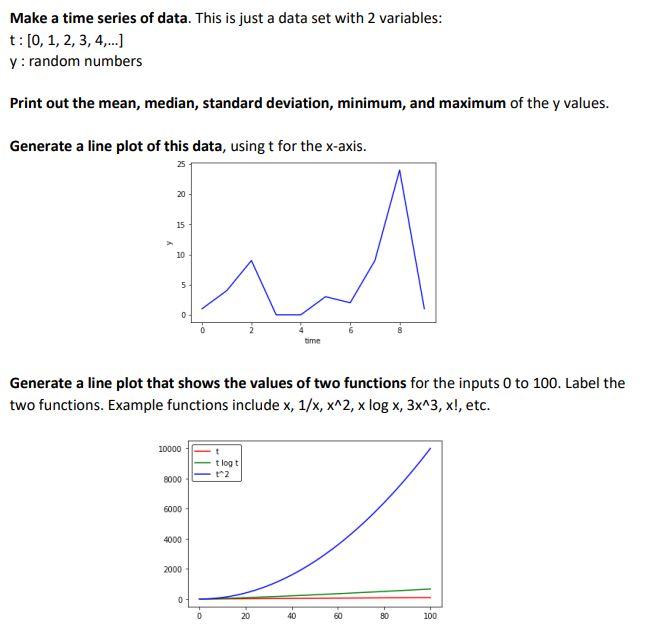
Make a time series of data. This is just a data set with 2 variables: t: [0, 1, 2, 3, 4,...) y: random numbers Print out the mean, median, standard deviation, minimum, and maximum of the y values. Generate a line plot of this data, using t for the x-axis. 25 20 15 w 10 5 time Generate a line plot that shows the values of two functions for the inputs 0 to 100. Label the two functions. Example functions include x, 1/x, x^2, x log x, 3x^3, x!, etc. 10000 t tlogt t2 8000 6000 4000 2000 0 . 0 20 40 60 80 100Step by Step Solution
There are 3 Steps involved in it
Step: 1

Get Instant Access to Expert-Tailored Solutions
See step-by-step solutions with expert insights and AI powered tools for academic success
Step: 2

Step: 3

Ace Your Homework with AI
Get the answers you need in no time with our AI-driven, step-by-step assistance
Get Started


