Please answer these questions with the information provided
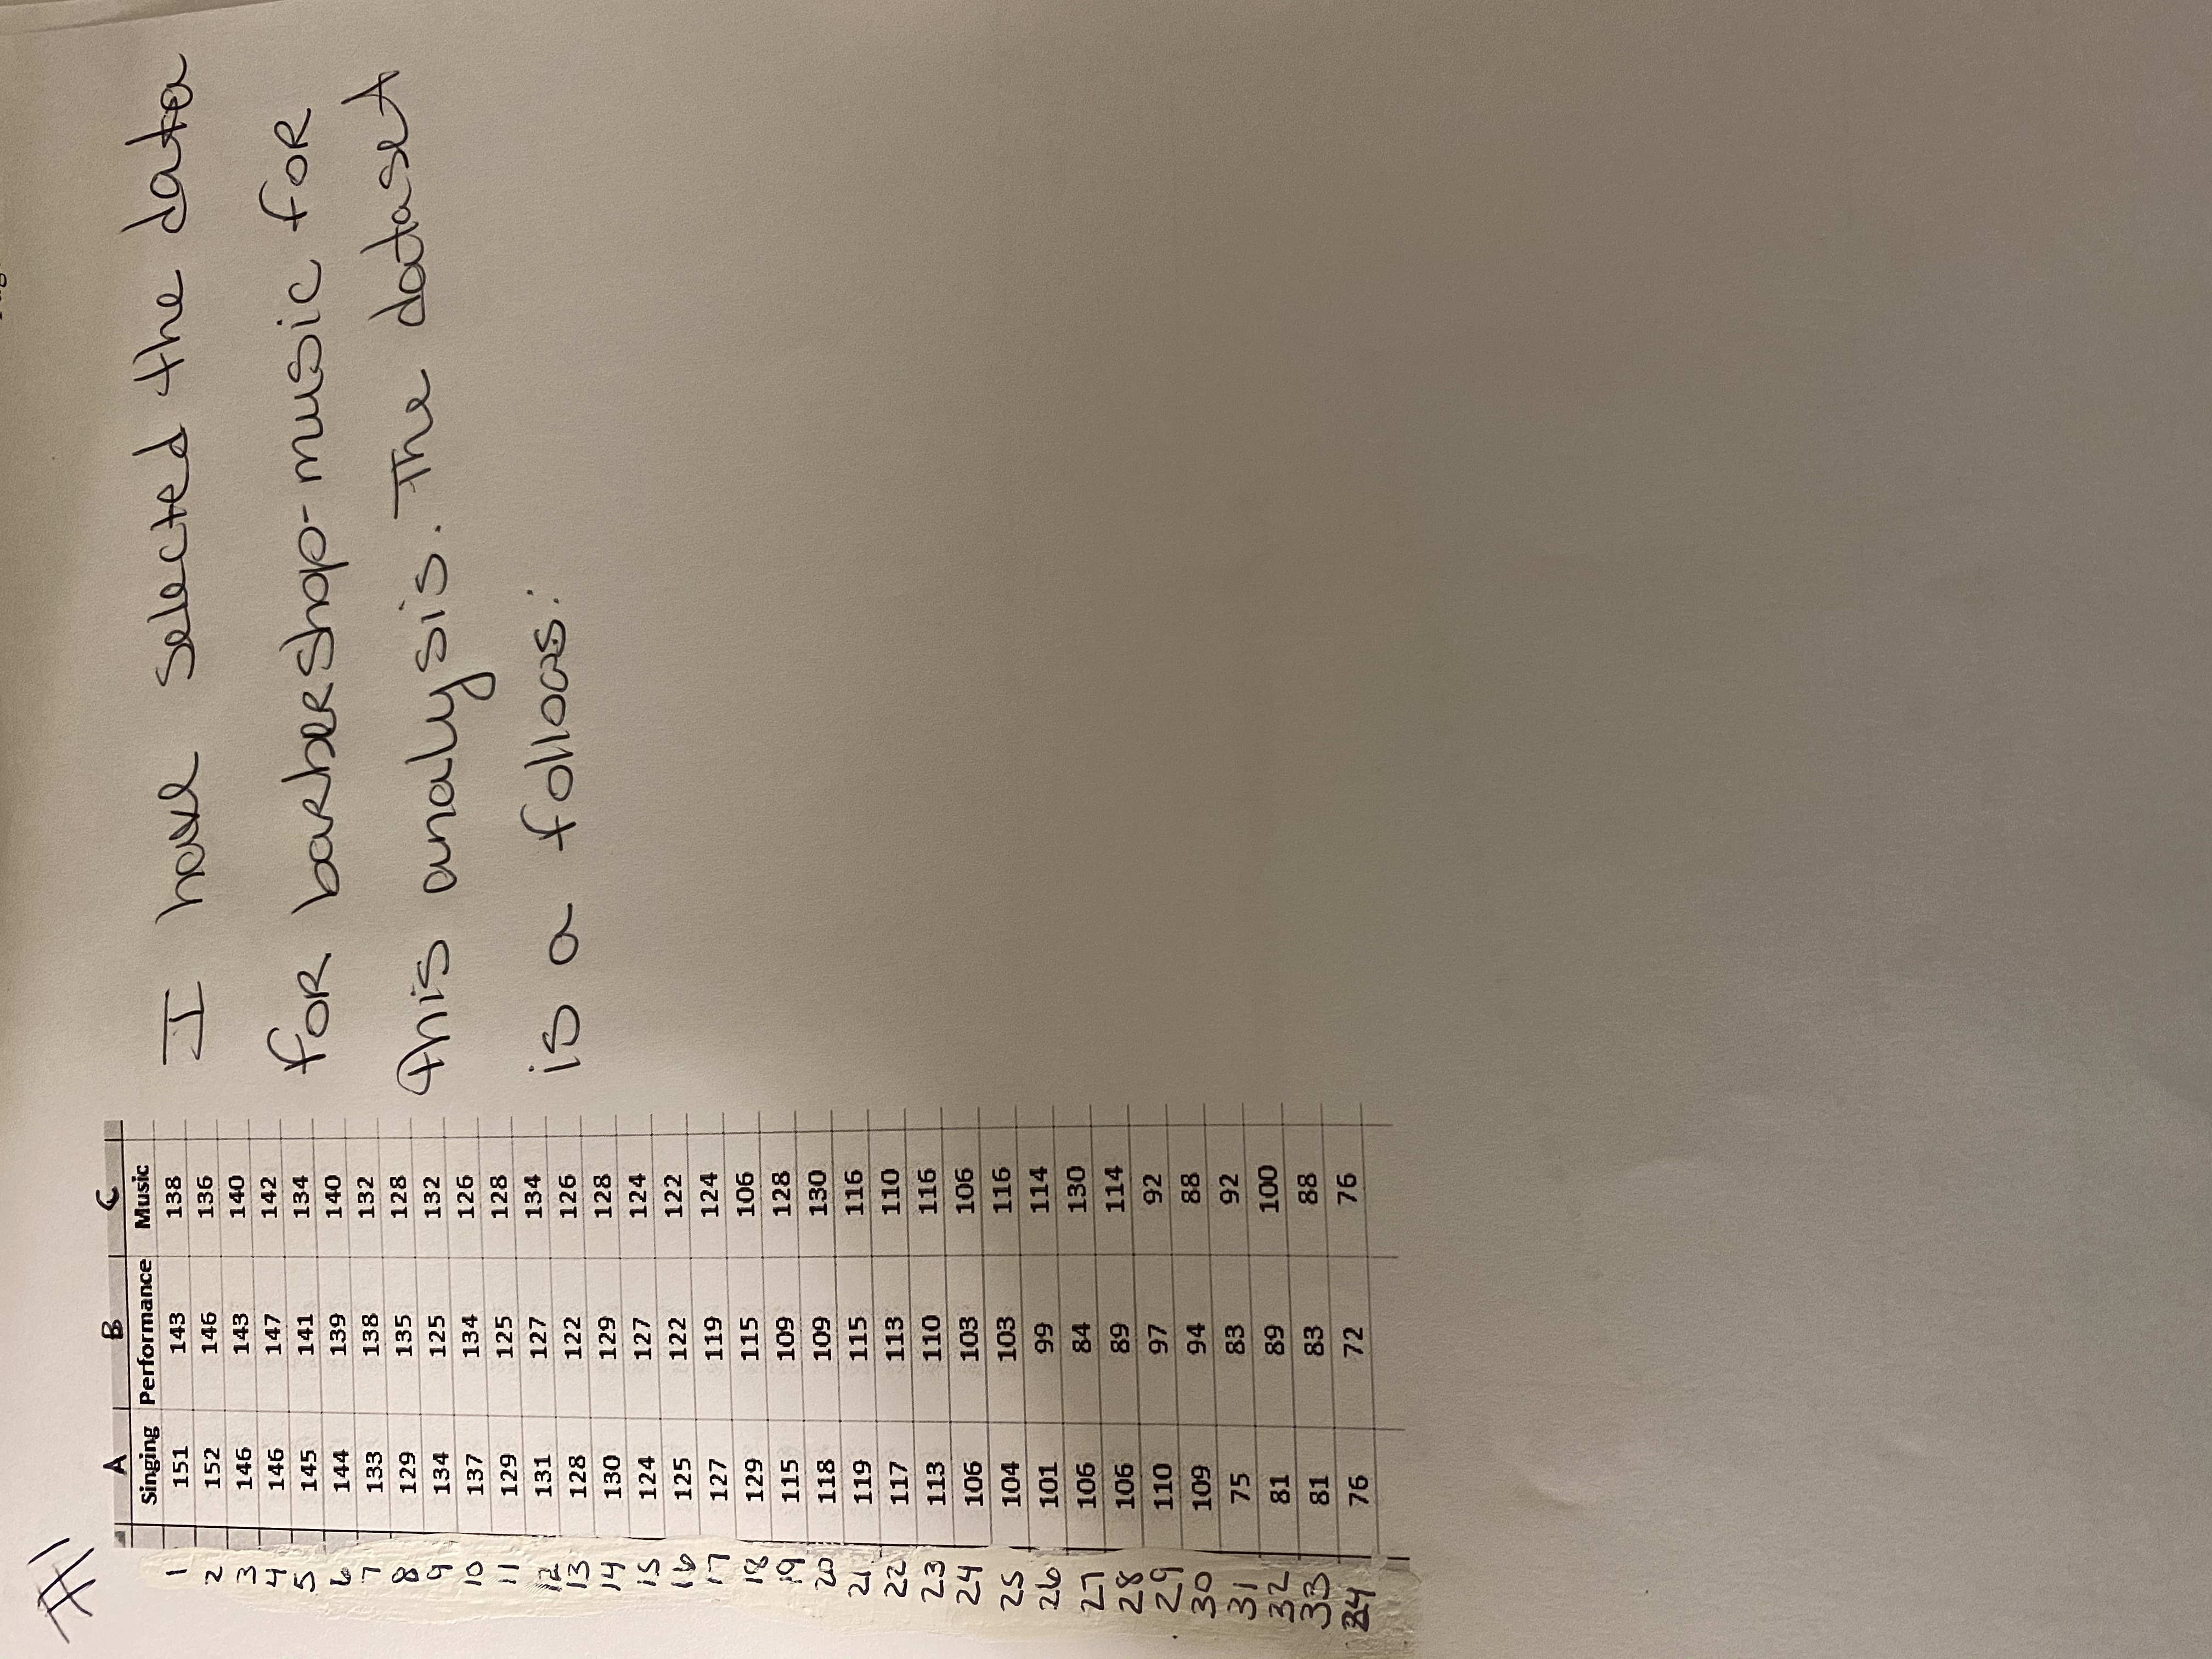
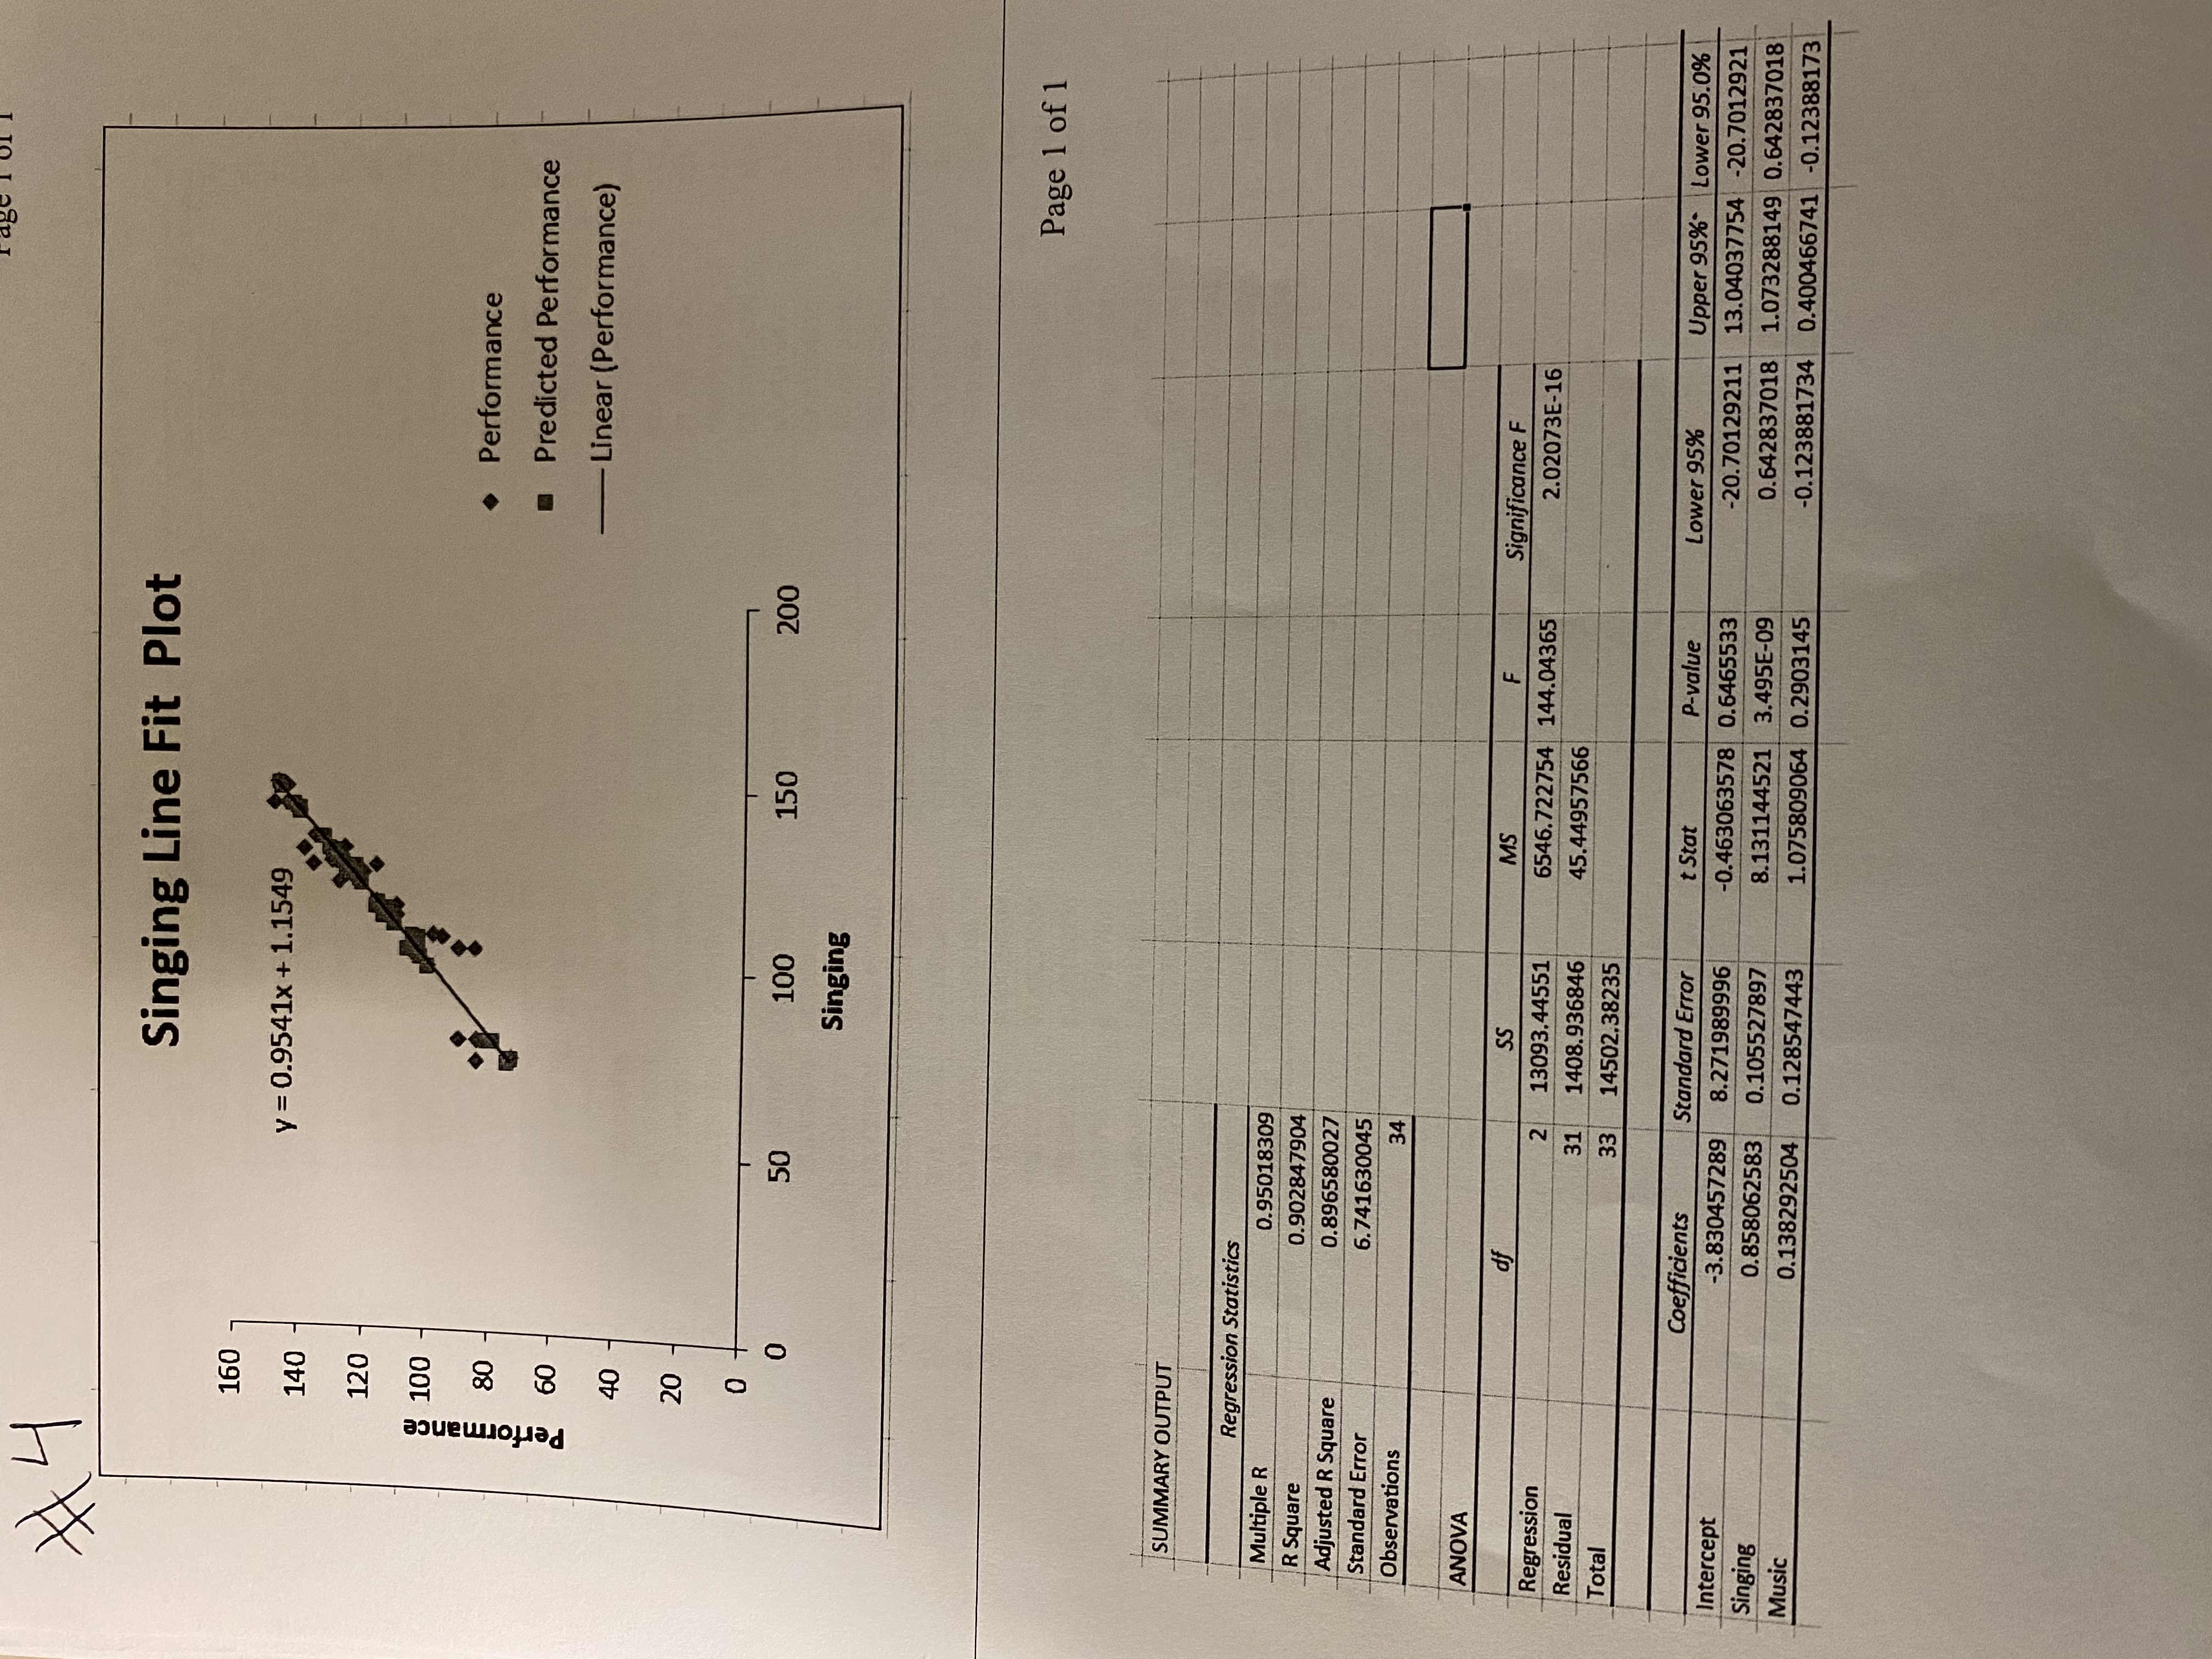
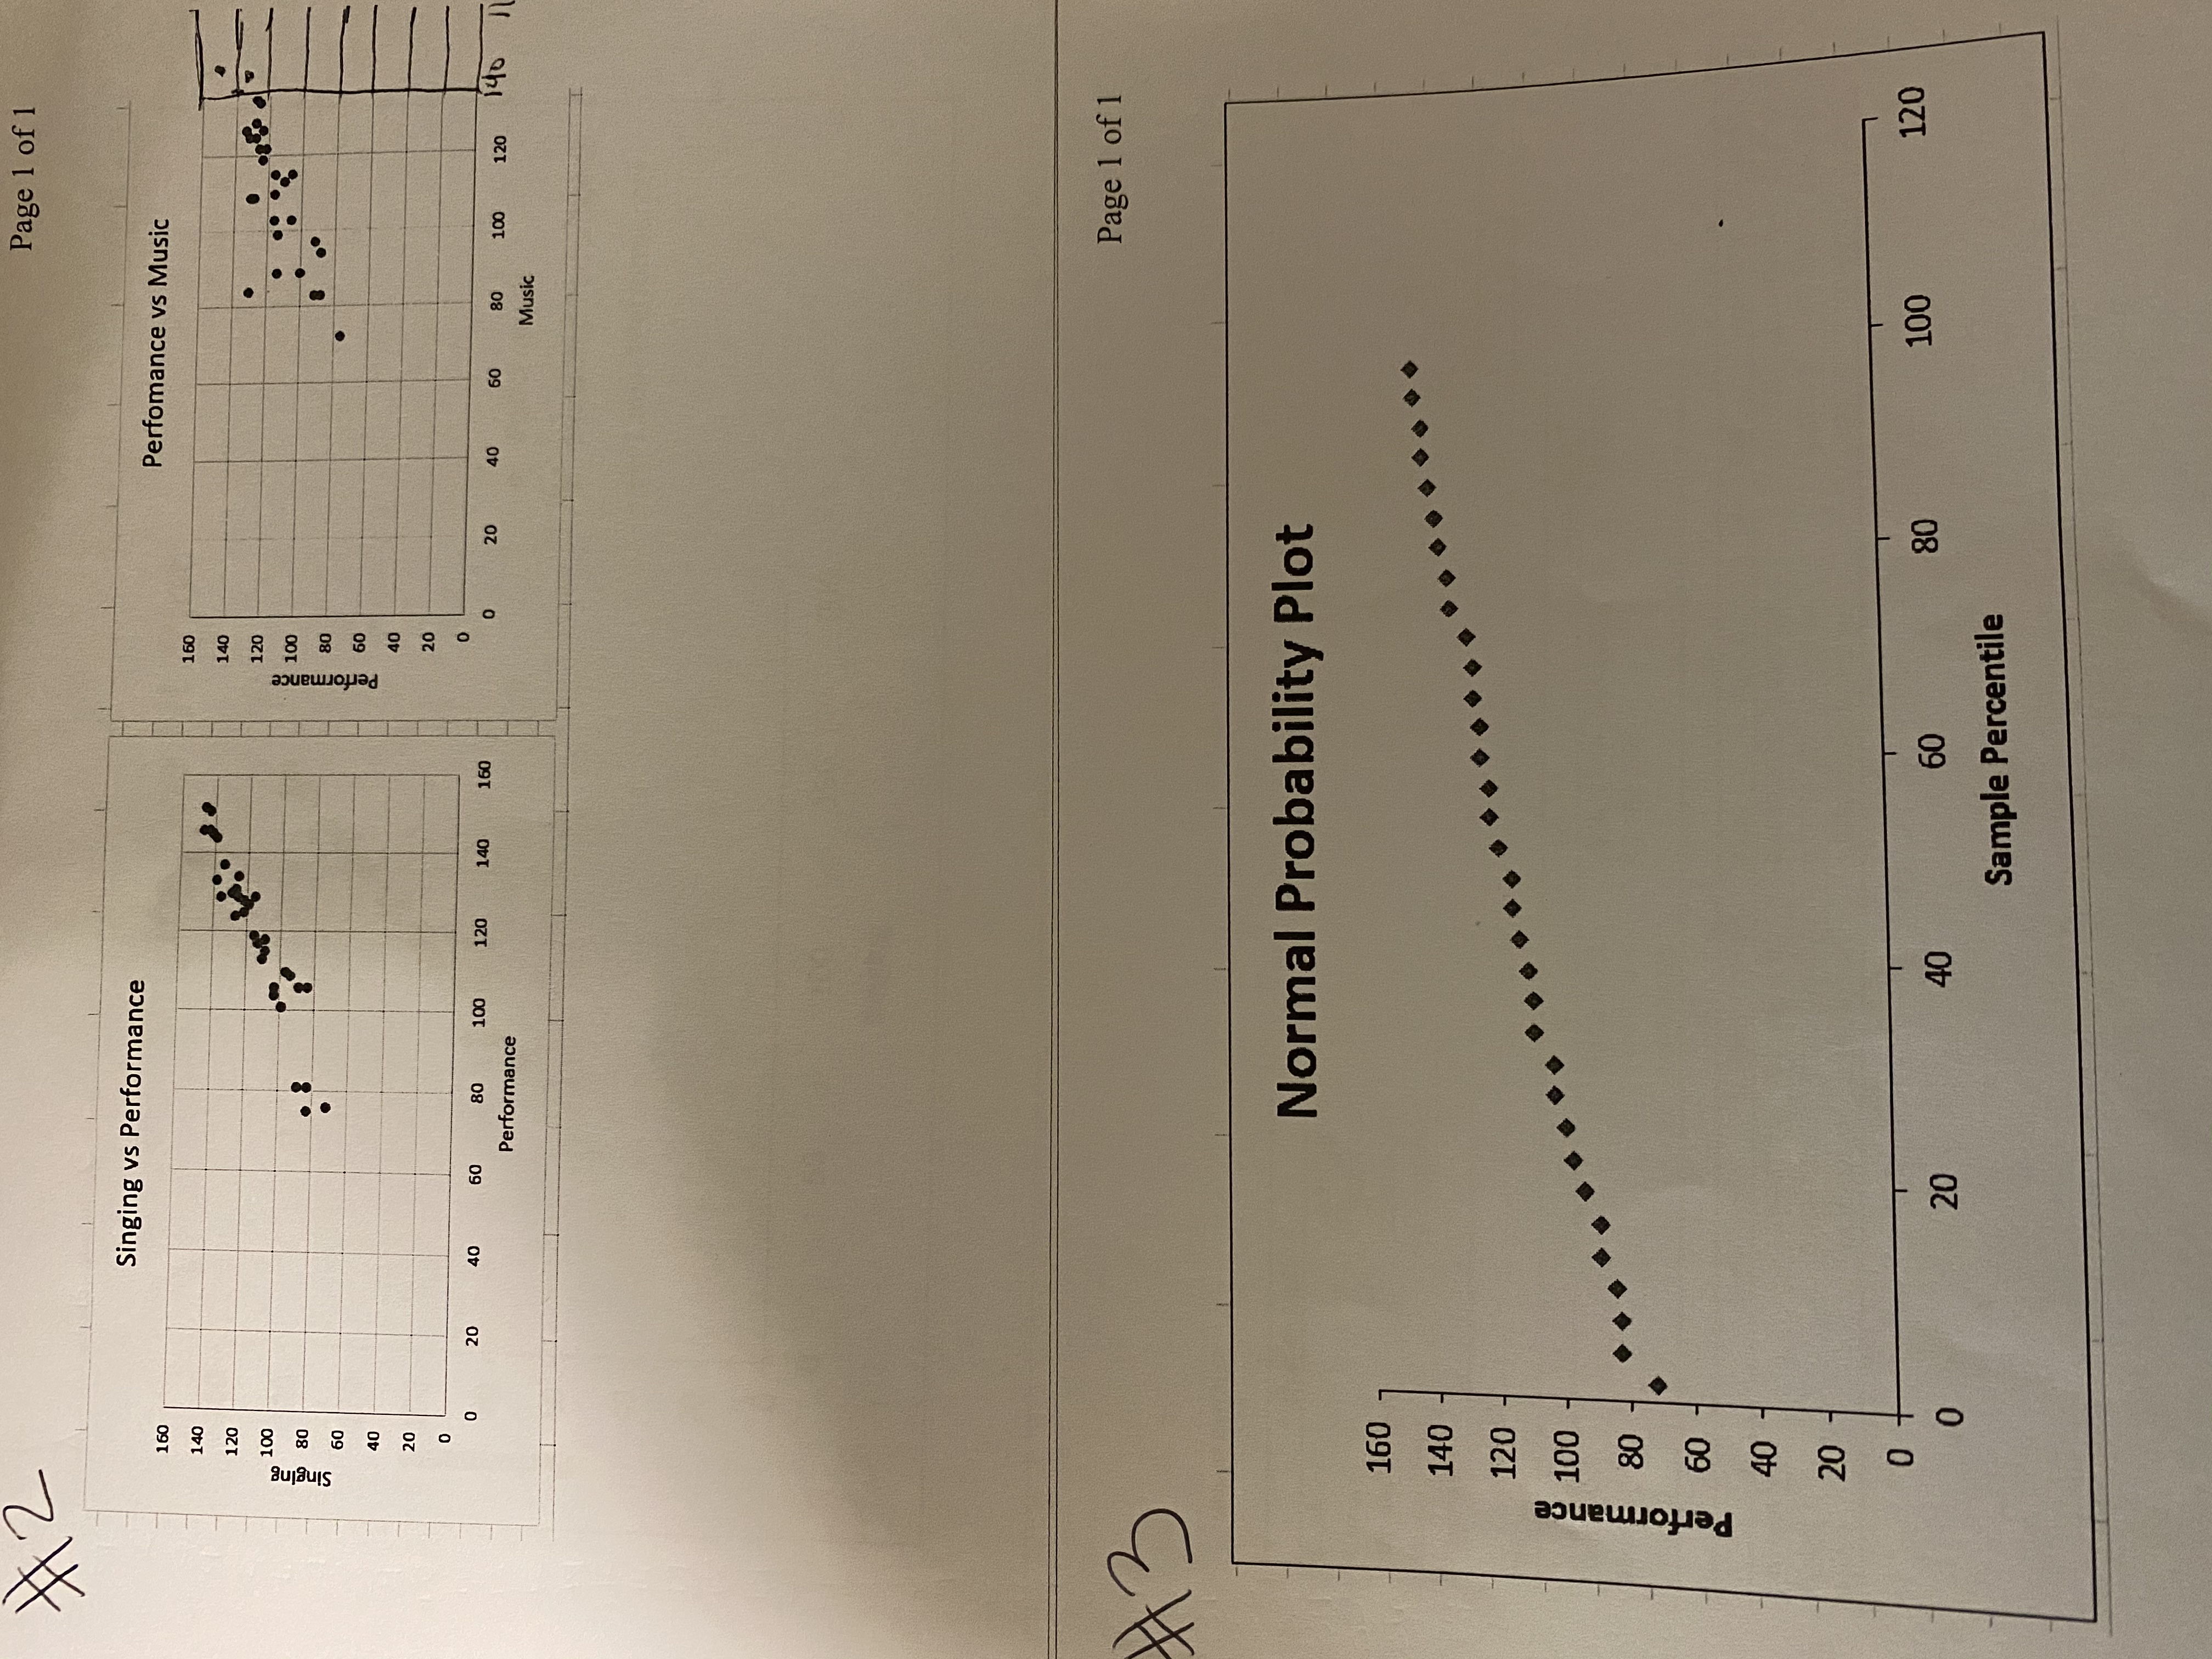
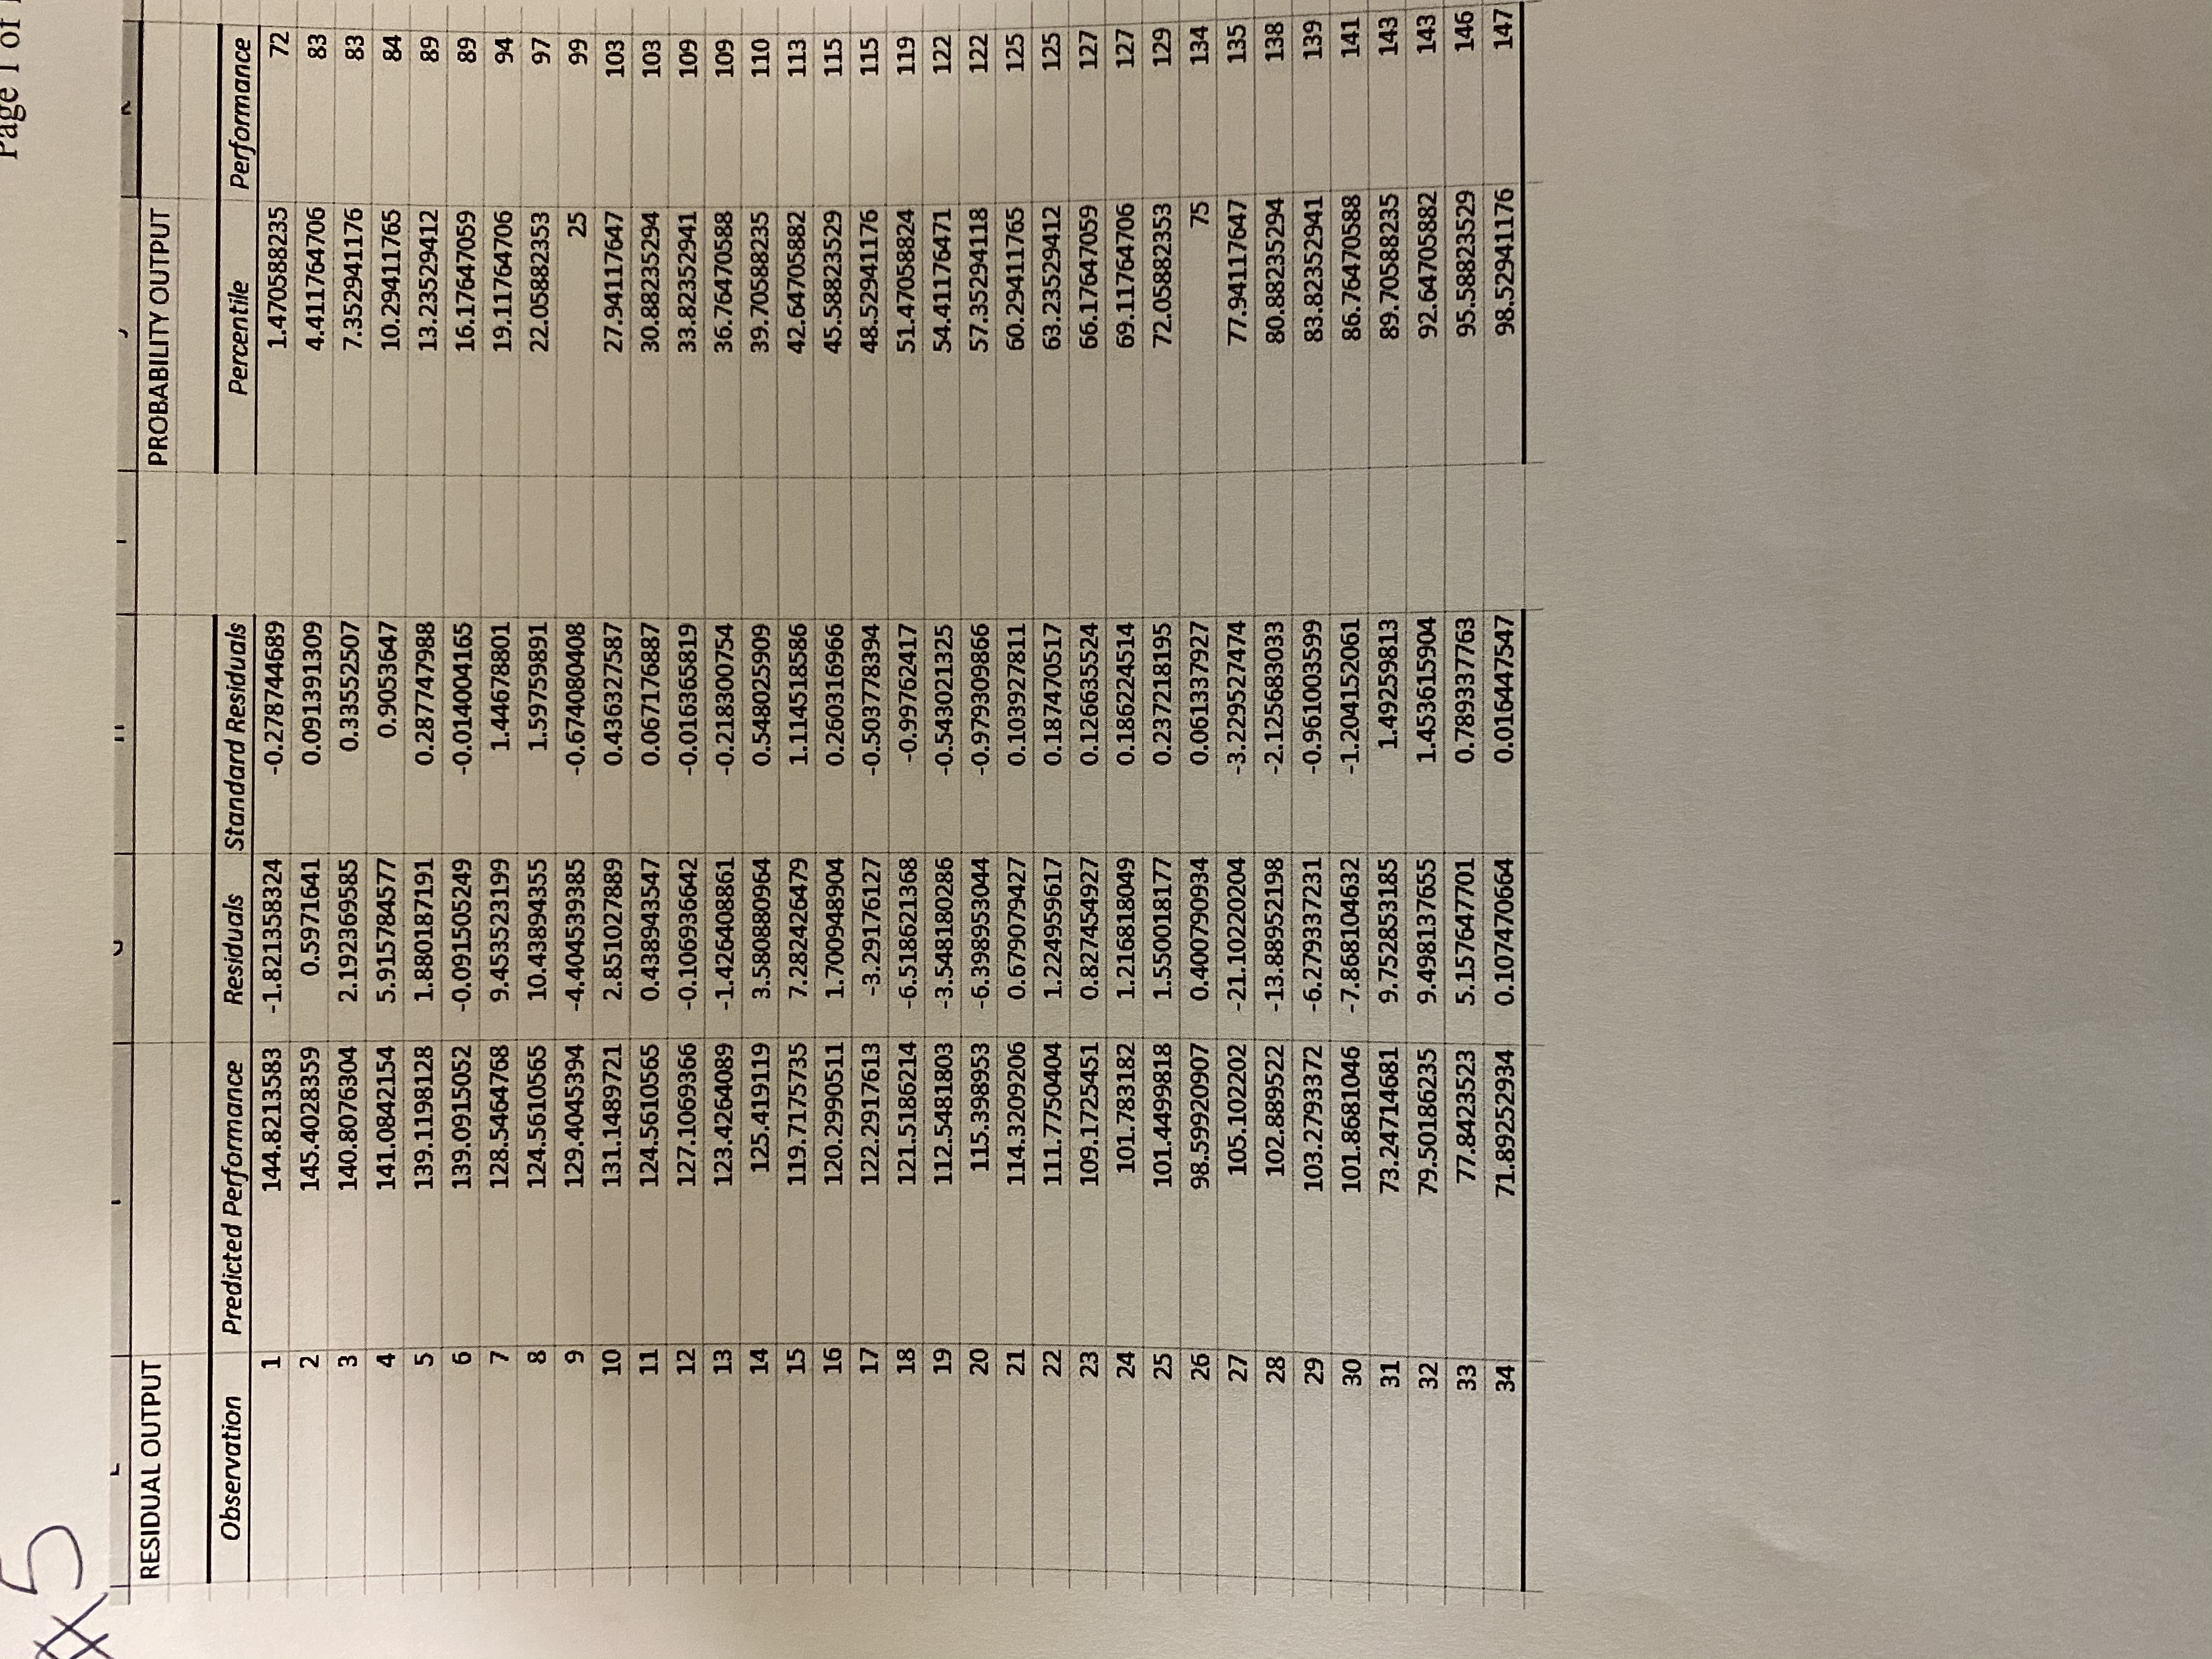
Singing Performance Music 151 143 138 152 146 136 I have selected the data 146 143 140 146 147 142 145 141 134 144 139 140 for barbershop-music for 133 138 132 129 135 128 134 125 132 this analysis. The dataset 137 134 126 129 125 128 131 127 134 128 122 126 is a follows: 130 129 128 124 127 124 125 122 122 17 127 119 124 129 115 106 115 109 128 118 109 130 119 115 116 22 117 113 110 23 113 110 116 24 106 103 106 25 104 103 116 26 101 99 114 27 106 84 130 28 106 89 114 29 110 97 92 30 109 94 88 31 75 83 92 32 81 89 100 33 81 83 88 34 76 72 76# 4 Singing Line Fit Plot 160 140 y = 0.9541x + 1.1549 120 Performance 100 80 Performance 60 Predicted Performance 40 - Linear (Performance) 20 0 50 100 150 200 Singing Page 1 of 1 SUMMARY OUTPUT Regression Statistics Multiple R 0.95018309 R Square 0.902847904 Adjusted R Square 0.896580027 Standard Error 6.741630045 Observations 34 ANOVA df SS MS Significance F Regression 2 13093.44551 6546.722754 144.04365 2.02073E-16 Residual 31 1408.936846 45.44957566 Total 33 14502.38235 Coefficients Standard Error t Stat P-value Lower 95% Upper 95% Lower 95.0% Intercept -3.830457289 8.271989996 0.463063578 0.6465533 20.70129211 13.04037754 -20.7012921 Singing 0.858062583 0.105527897 8.131144521 3.495E-09 0.642837018 1.073288149 0.642837018 Music 0.138292504 0.128547443 1.075809064 0.2903145 0.123881734 0.400466741 -0.12388173From the printouts, answer the following questions on a separate piece of paper: 1. A description of your data set. i.e where you got it, how you collected it, why do you think there might be a linear relationship between the two variables? 2. What is your explanatory variable and what is your response variable? 3. What is the least squares regression line? 4. Give a predicted value of y for a value of the explanatory variable which is not an actual observation in your data set. 5. What is the coefficient of determination, r2. Explain the meaning of r2 in relation to your analysis.# 2 Page 1 of 1 Singing vs Performance Perfomance vs Music 160 140 160 120 140 120 to 100 Singing 8 8 8 8 1 8 Performance 100 80 60 40 20 20 40 80 100 120 140 o 50 160 20 40 50 80 100 120 140 Performance Music Page 1 of 1 $ 3 Normal Probability Plot 160 140 120 Performance 100 0 8 8 8 8 80 100 120 0 20 40 60 Sample PercentileRESIDUAL OUTPUT PROBABILITY OUTPUT Observation Predicted Performance Residuals Standard Residuals Percentile Performance 144.8213583 1.821358324 -0.278744689 L.470588235 OUT A WN 145.4028359 0.5971641 0.091391309 4.411764706 140.8076304 2.192369585 0.33552507 7.352941176 83 141.0842154 5.915784577 0.9053647 10.29411765 84 139.1198128 1.880187191 0.287747988 13.23529412 89 139.0915052 -0.091505249 0.014004165 16.17647059 89 128.5464768 9.453523199 1.44678801 19.11764706 94 8 124.5610565 10.43894355 1.59759891 22.05882353 97 129.4045394 -4.404539385 -0.674080408 25 99 10 131.1489721 2.851027889 0.436327587 27.94117647 103 11 124.5610565 0.438943547 0.067176887 30.88235294 103 12 127.1069366 -0.106936642 -0.016365819 33.82352941 109 13 123.4264089 1.426408861 0.218300754 36.76470588 109 14 125.419119 3.580880964 0.548025909 39.70588235 110 15 119.7175735 7.282426479 1.114518586 42.64705882 113 16 120.2990511 1.700948904 0.260316966 45.58823529 115 17 122.2917613 -3.29176127 -0.503778394 48.52941176 115 18 121.5186214 -6.518621368 0.99762417 51.47058824 119 19 112.5481803 -3.548180286 0.543021325 54.41176471 122 20 115.398953 -6.398953044 -0.979309866 57.35294118 122 21 114.3209206 0.679079427 0.103927811 60.29411765 125 22 111.7750404 1.224959617 0.187470517 63.23529412 125 23 109.1725451 0.827454927 0.126635524 66.17647059 127 24 101.783182 1.216818049 0.186224514 69.11764706 127 25 101.4499818 1.550018177 0.237218195 72.05882353 129 26 98.59920907 0.400790934 0.061337927 75 134 27 105.102202 -21.10220204 3.229527474 77.94117647 135 28 102.889522 -13.88952198 -2.125683033 80.88235294 138 29 103.2793372 -6.279337231 0.961003599 83.82352941 139 30 101.8681046 -7.868104632 1.204152061 86.76470588 141 31 73.24714681 9.752853185 1.49259813 89.70588235 143 32 79.50186235 9.498137655 1.453615904 92.64705882 143 33 77.8423523 5.157647701 0.789337763 95.58823529 146 34 71.89252934 0.107470664 0.016447547 98.52941176 147


