Please answer these two questions about "Netflix."
You can answer based on these pictures that shows Netflix Financial Statement if you need.
"Netflix" Liability & Equity Details
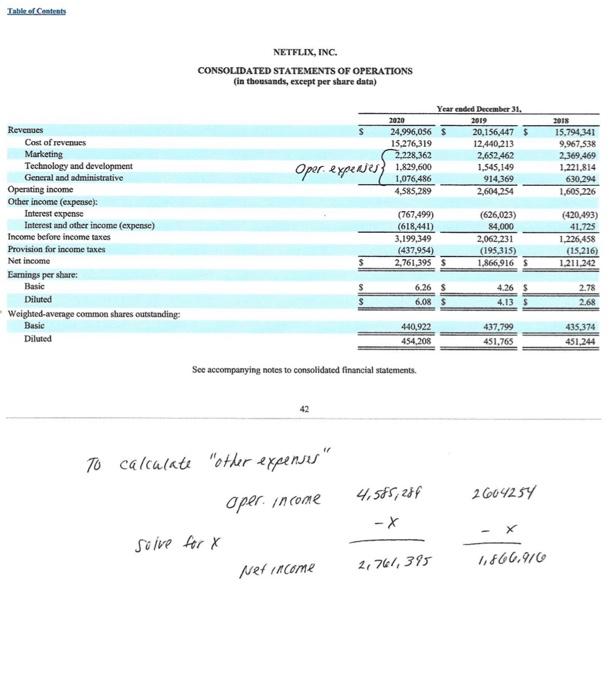
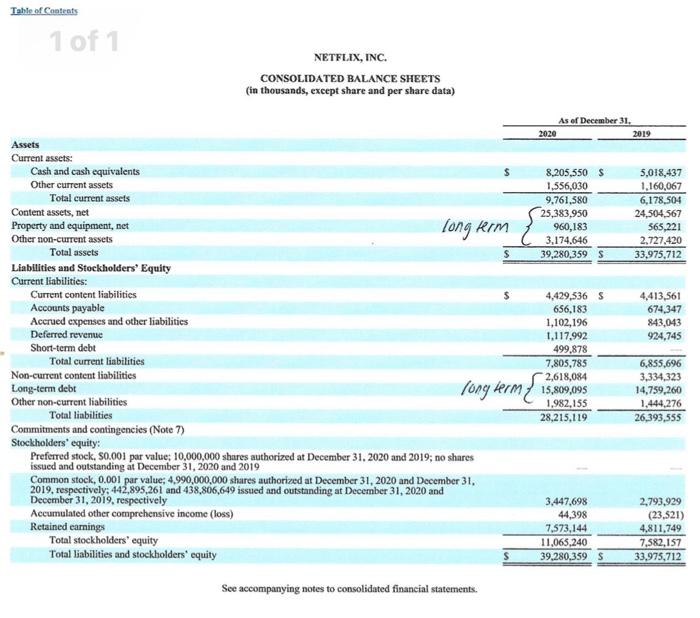
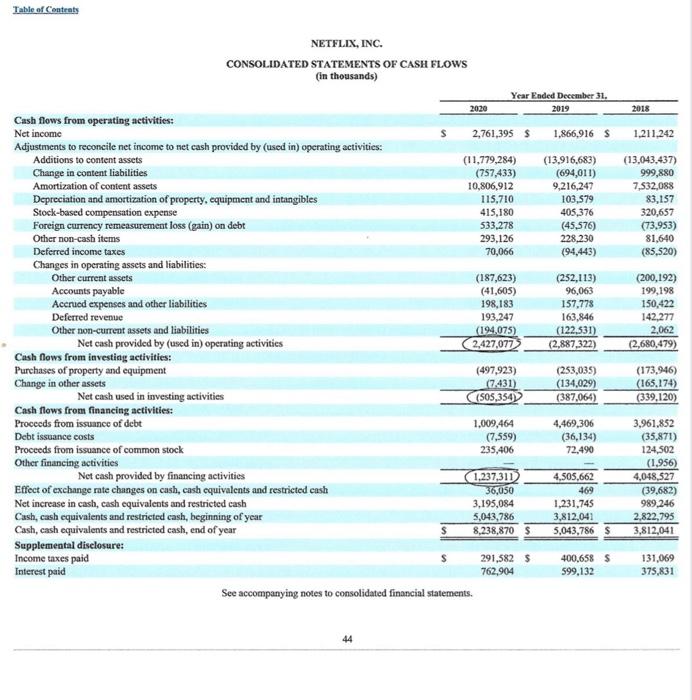
Part 2: Liability & Equity Details 1. 1) What is your company's largest current liability and its amount as of the current year-end? What is the company's largest long-term liability? 12) What types of accounts are included in your company's equity? (1.e. Retained Earnings, Common Stock, Treasury Stock, etc.)? Provide a summary of the balances in these equity accounts for the most recent year and make sure it sums up to the total equity presented on the balance sheet. Table of Contents NETFLIX, INC. CONSOLIDATED STATEMENTS OF OPERATIONS (in thousands, except per share data) s Year ended December 31, 2020 2019 24,996,056 $ 20,156,447 $ 15.276,319 12,440,213 2.228.362 2,652.462 1,545,149 1,076,486 914.369 4.585,289 2,604,254 2018 15.794.341 9,967,538 2,369,469 1,221,814 630.294 1,605, 226 Oper expenses 1.829.600 Revenues Cost of revenues Marketing Technology and development General and administrative Operating income Other income (expense): Interest expense Interest and other income (expense) Income before income taxes Provision for income taxes Net income Earnings per share: Basic Diluted - Weighted average common shares outstanding Basic Diluted (767,499) (618,441) 3.199,349 (437,954) 2,761,3955 (626,023) 84,000 2,062,231 (195 315) 1,866,916 (420,493) 41.725 1.226,458 (15.216) 1.211.242 $ 6.26 $ 6.08 $ 4.26 $ 4.13 $ 2.78 2.68 440,922 454,208 437.799 451,765 435,374 451,244 See accompanying notes to consolidated financial statements. 4,585,286 2604254 76 calculate "other expenses" 70 aper income soive for X Net Income 2,761,395 1,860,916 Table of Contents 1 of 1 NETFLIX, INC. CONSOLIDATED BALANCE SHEETS (in thousands, except share and per share data) As of December 31, 2020 2019 8,205,550 $ 1.556,030 9,761,580 25,383,950 960,183 3,174.646 39,280,3595 5,018,437 1.160,067 6,178,504 24,504,567 565,221 2.727,420 33,975,712 $ 4,413,561 674.347 843,043 924,745 Assets Current assets: Cash and cash equivalents Other current assets Total current assets Content assets, net Property and equipment, net long kim Other non-current assets Total assets Liabilities and Stockholders' Equity Current liabilities: Current content liabilities Accounts payable Accrued expenses and other liabilities Deferred revenue Short-term debt Total current liabilities Non-current content liabilities Long-term debt Other non-current liabilities Total liabilities Commitments and contingencies (Note 7) Stockholders' equity: Preferred stock. S0.001 par value: 10,000,000 shares authorized at December 31, 2020 and 2019; no shares issued and outstanding at December 31, 2020 and 2019 Common stock, 0.001 par value; 4.990,000,000 shares authorized at December 31, 2020 and December 31, 2019, respectively: 442,895,261 and 438,806,649 issued and outstanding at December 31, 2020 and December 31, 2019, respectively Accumulated other comprehensive income (loss) Retained earnings Total stockholders' equity Total liabilities and stockholders' equity 4,429,536 656,183 1,102,196 1.117.992 499,878 7.805,785 2,618,084 15,809,095 1.982,155 28,215,119 long term { 6,855,696 3,334,323 14,759,260 1,444,276 26,393,555 3,447,698 44,398 7,573,144 11,065,240 39.280,359 2,793,929 (23.521) 4,811,749 7,582,157 33,975,712 See accompanying notes to consolidated financial statements. Table of Contents 2019 2018 1.211.242 (13.043,437) 999,880 7,532,088 83,157 320,657 (73.953) 81,640 (85,520) NETFLIX, INC. CONSOLIDATED STATEMENTS OF CASH FLOWS (in thousands) Year Ended December 31. 2030 Cash flows from operating activities: Net income 2,761,395$ 1,866,916 S Adjustments to reconcile net income to net cash provided by (used in) operating activities: Additions to content assets (11,779,284) (13,916,683) Change in content liabilities (757,433) (694,011) Amortization of content assets 10,806,912 9,216,247 Depreciation and amortization of property, equipment and intangibles 115.710 103,579 Stock-based compensation expense 415,180 405,376 Foreign currency remeasurement loss (gain) on debt 533,278 (45,576) Other non-cash items 293,126 228,230 Deferred income taxes 70,066 (94,443) Changes in operating assets and liabilities: Other current assets (187,623) (252,113) Accounts payable (41,605) 96,063 Accrued expenses and other liabilities 198,183 157,778 Deferred revenue 193,247 163,846 Other non-current assets and liabilities (194,075) (122,531) Net cash provided by (used in) operating activities 2,427,077 (2,887,322) Cash Nows from investing activities: Purchases of property and equipment (497,923) (253,035) Change in other assets (7.431) (134,029) Net cash used in investing activities (SOS,354) (387,064) Cash flows from financing activities: Proceeds from issuance of debt 1,009,464 4,469,306 Debt issuance costs (7,559) (36,134) Proceeds from issuance of common stock 235,406 72.490 Other financing activities Net cash provided by financing activities 1.237,311 4,505,662 Effect of exchange rate changes on cash, cash equivalents and restricted cash 36,050 469 Net increase in cash, cash equivalents and restricted cash 3,195,084 1,231,745 Cash, cash equivalents and restricted cash, beginning of year 5,043,786 3,812,041 Cash, cash equivalents and restricted cash, end of year 8,238,870 $ 5,043,786 $ Supplemental disclosure: Income taxes paid 291,582 5 400,658 5 Interest paid 762,904 599,132 See accompanying notes to consolidated financial statements. (200,192) 199,198 150,422 142,277 2,062 (2,680,479) (173,946) (165.174) (339,120) 3,961,852 (35,871) 124,502 (1.956) 4,048,527 (39,682) 989,246 2,822,795 3,812,041 131,069 375,831 44