Answered step by step
Verified Expert Solution
Question
1 Approved Answer
Please answer this probelm in MATLAB code (using the math equations that are given above) and provide plot Bacterial growth Recall that the simplest expression


Please answer this probelm in MATLAB code (using the math equations that are given above) and provide plot
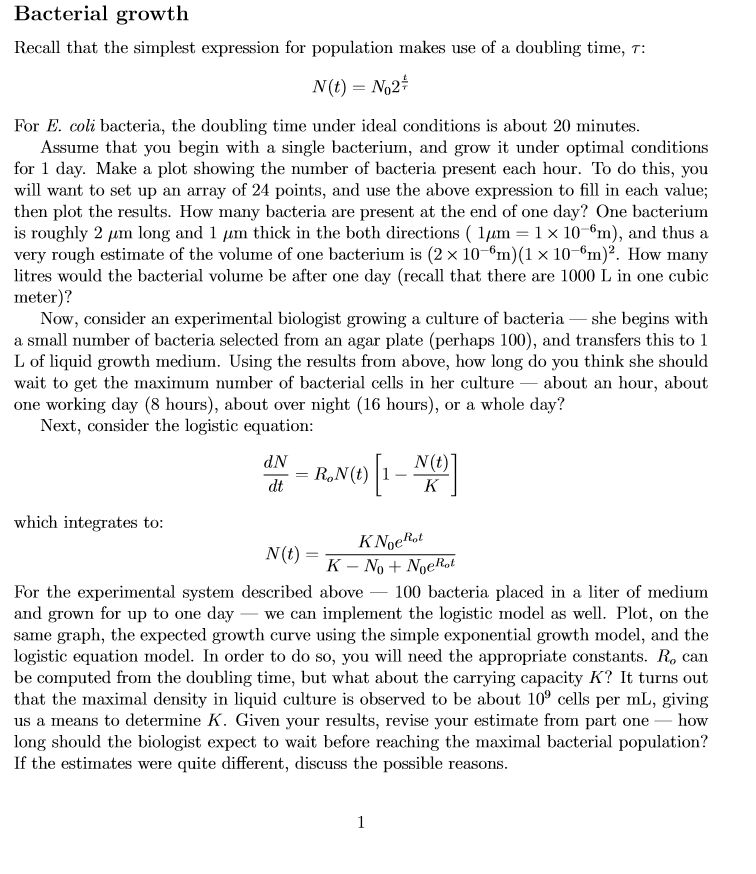
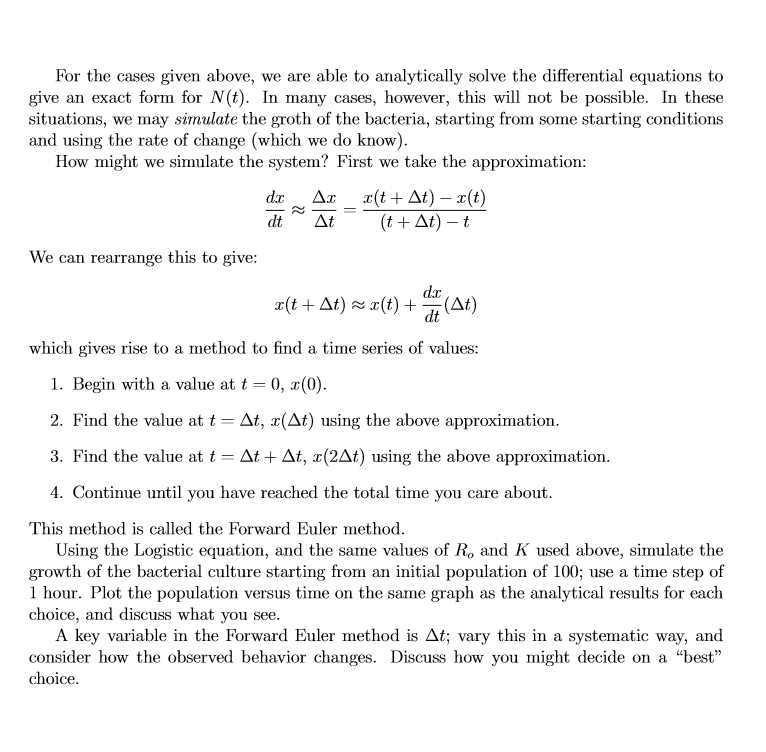
Bacterial growth Recall that the simplest expression for population makes use of a doubling time, N (t) = N For E. coli bacteria, the doubling time under ideal conditions is about 20 minutes Assume that you begin with a single bacterium, and grow it under optimal conditions for 1 day. Make a plot showing the number of bacteria present each hour. To do this, you will want to set up an array of 24 points, and use the above expression to fill in each value; then plot the results. How many bacteria are present at the end of one day? One bacterium is roughly 2 rn long and I m thick in the both directions ( 1 |rn 1 x 10 6m), and thus a very rough estimate of the volume of one bacterium is (2 x 10⁻⁶m)(1 x 10⁶m). How many litres would the bacterial volume be after one day (recall that there are 1000 L in one cubic meter)? Now, consider an experimental biologist growing a culture of bacteria -she begins with a small number of bacteria selected from an agar plate (perhaps 100), and transfers this to 1 L of liquid growth medium. Using the results from above, how long do you think she should wait to get the maximum number of bacterial cells in her culture _about an hour, about one working day (8 hours), about over night (16 hours), or a whole day? Next, consider the logistic equation dNRNO) which integrates to KNgeRst For the experimental system described above100 bacteria placed in a liter of medium and grown for up to one day _we can implement the logistic model as well. Plot, on the same graph, the expected growth curve using the simple exponential growth model, and the logistic equation model. In order to do so, you will need the appropriate constants. Ro can be computed from the doubling time, but what about the carrying capacity K? It turns out that the maximal density in liquid culture is observed to be about 10 cells per mL, giving us a means to determine K. Given your results, revise your estimate from part one _how long should the biologist expect to wait before reaching the maximal bacterial population? If the estimates were quite different, discuss the possible reasonsStep by Step Solution
There are 3 Steps involved in it
Step: 1

Get Instant Access to Expert-Tailored Solutions
See step-by-step solutions with expert insights and AI powered tools for academic success
Step: 2

Step: 3

Ace Your Homework with AI
Get the answers you need in no time with our AI-driven, step-by-step assistance
Get Started


