Please answer this question.
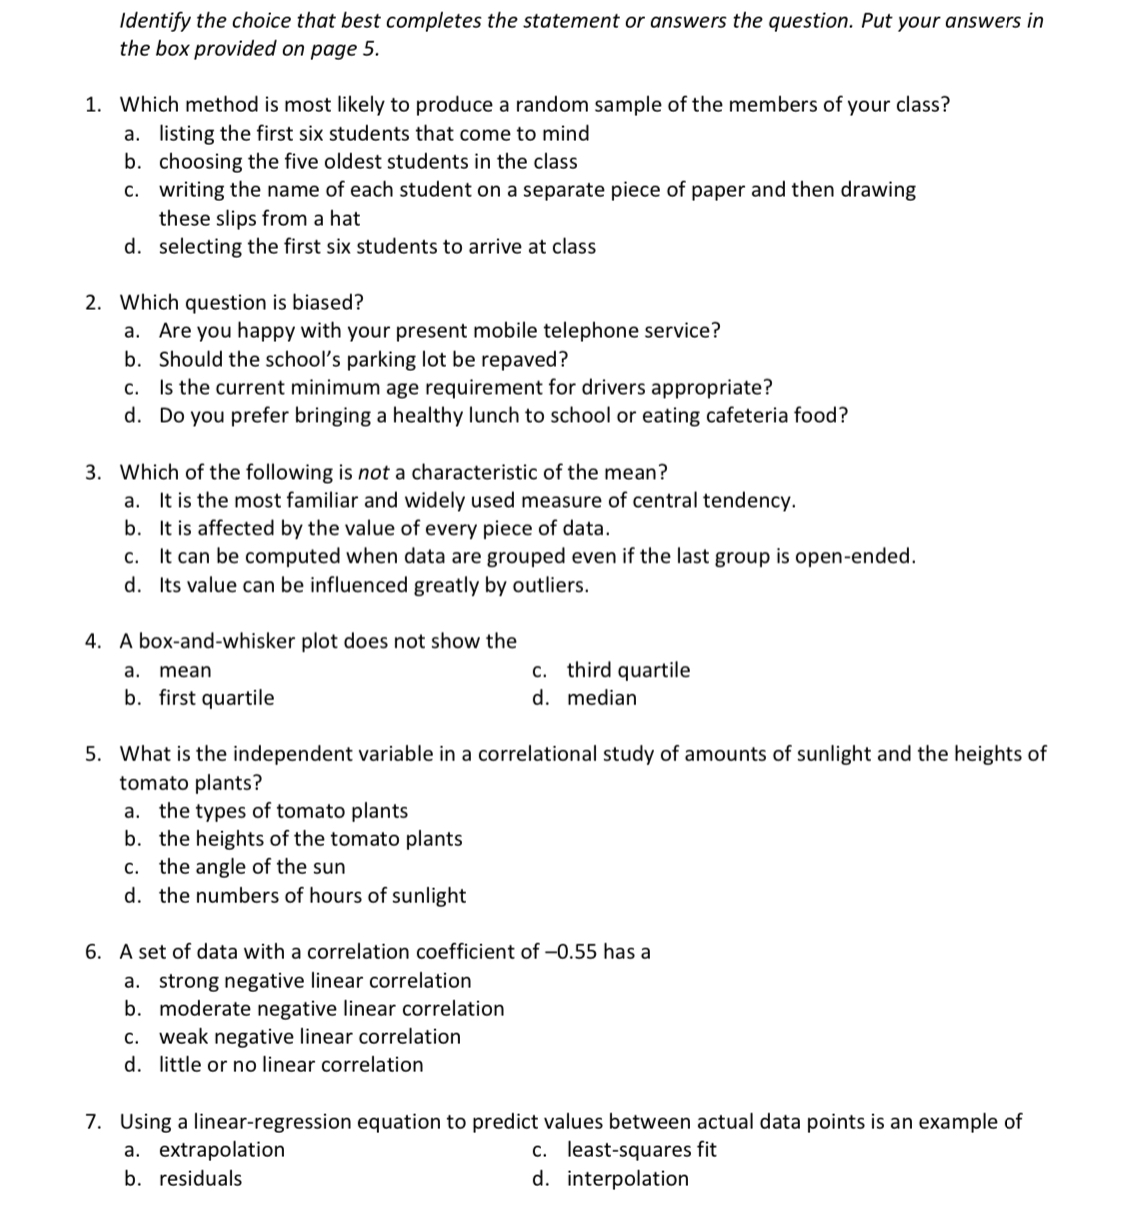
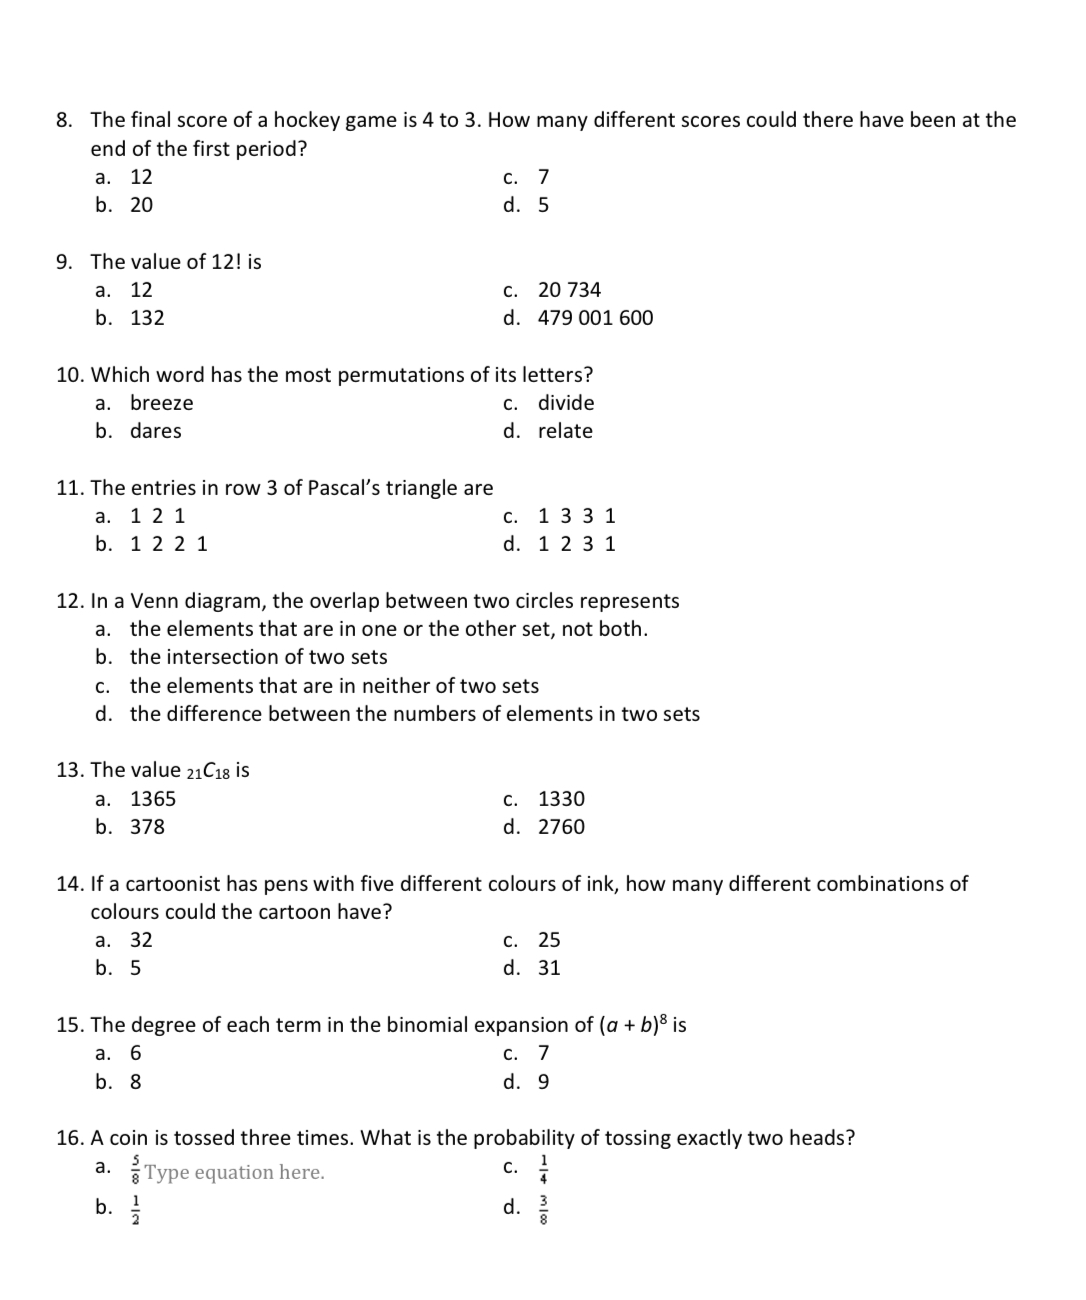
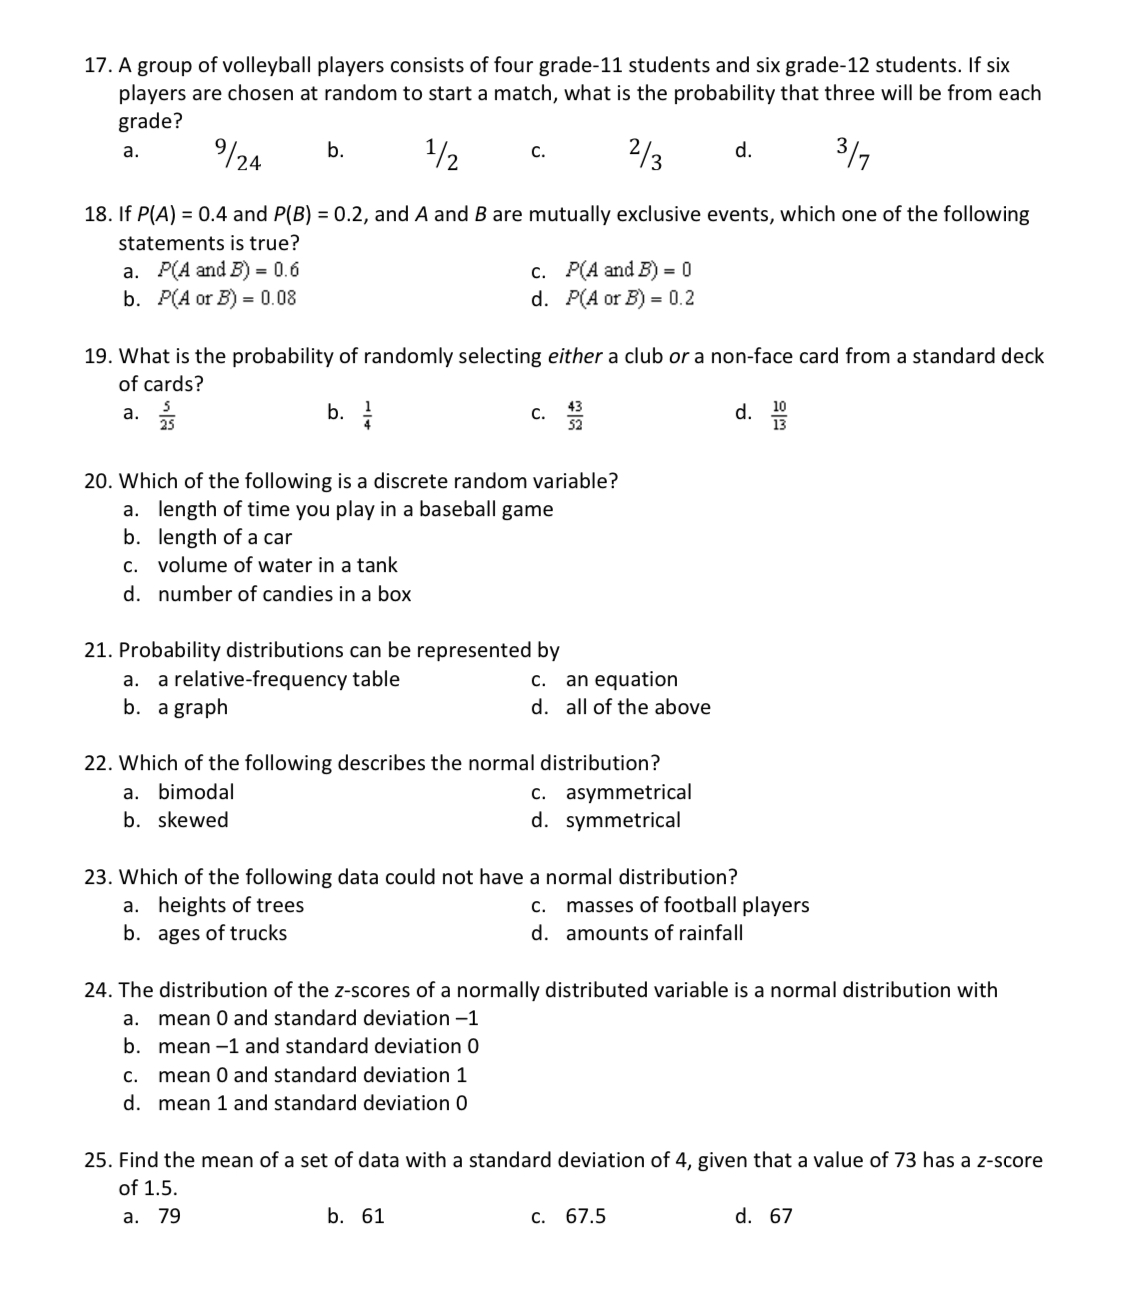
identify the choice that best completes the statement or answers the question. Put your answers in the box provided on page 5. . Which method is most likely to produce a random sample of the members of your class? a. listing the first six students that come to mind b. choosing the five oldest students in the class c. writing the name of each student on a separate piece of paper and then drawing these slips from a hat d. selecting the first six students to arrive at class . Which question is biased? a. Are you happy with your present mobile telephone service? b. Should the school's parking lot be repaved? C. Is the current minimum age requirement for drivers appropriate? d. Do you prefer bringing a healthy lunch to school or eating cafeteria food? . Which of the following is not a characteristic of the mean? a. It is the most familiar and widely used measure of central tendency. b. It is affected by the value of every piece of data. c. It can be computed when data are grouped even if the last group is open-ended. d. Its value can be influenced greatly by outliers. . A box-and-whisker plot does not show the a. mean c. third quartile b. first quartile d. median . What is the independent variable in a correlational study of amounts of sunlight and the heights of tomato plants? a. the types of tomato plants b. the heights of the tomato plants c. the angle of the sun d. the numbers of hours of sunlight . A set of data with a correlation coefficient of 0.55 has a a. strong negative linear correlation b. moderate negative linear correlation c. weak negative linear correlation d. little or no linear correlation . Using a linear-regression equation to predict values between actual data points is an example of a. extrapolation c. least-squares fit b. residuals d. interpolation 10. 11. 12. 13. 14. 15. 16. The nal score of a hockey game is 4 to 3. How many different scores could there have been at the end of the rst period? a. 12 c. 7 b. 20 d. 5 The value of 12! is a. 12 c. 20 734 b. 132 d. 479001600 Which word has the most permutations of its letters? a. breeze c. divide b. dares d. relate The entries in row 3 of Pascal's triangle are a. 1 2 1 c. 1 3 3 1 b. 1 2 2 1 d. 1 2 3 1 In a Venn diagram, the overlap between two circles represents a. the elements that are in one or the other set, not both. b. the intersection of two sets c. the elements that are in neither of two sets d. the difference between the numbers of elements in two sets The value 21cm is a. 1365 c. 1330 b. 378 d. 2760 If a cartoonist has pens with five different colours of ink, how many different combinations of colours could the cartoon have? a. 32 c. 25 b. 5 d. 31 The degree of each term in the binomial expansion of (or + big is a. 6 c. 7 b. 8 d. 9 A coin is tossed three times. What is the probability of tossing exactly two heads? a. Type equation here. '3' % 1 3 b. 5 d. 5 17. A group of volleyball players consists of four grade-11 students and six grade-12 students. If six players are chosen at random to start a match, what is the probability that three will be from each grade? a. 9/ 24 b. 1/ 2 C . 2/3 d. 3/ 7 18. If P(A) = 0.4 and P(B) = 0.2, and A and B are mutually exclusive events, which one of the following statements is true? a. P(A and B) = 0.6 c. P(A and B) = 0 b. P(A or B) = 0.08 d. P(A or B) = 0.2 19. What is the probability of randomly selecting either a club or a non-face card from a standard deck of cards? a. 75 b. C. 32 d. 10 20. Which of the following is a discrete random variable? a. length of time you play in a baseball game b. length of a car c. volume of water in a tank d. number of candies in a box 21. Probability distributions can be represented by a. a relative-frequency table c. an equation b. a graph d. all of the above 22. Which of the following describes the normal distribution? a. bimodal c. asymmetrical b. skewed d. symmetrical 23. Which of the following data could not have a normal distribution? a. heights of trees c. masses of football players b. ages of trucks d. amounts of rainfall 24. The distribution of the z-scores of a normally distributed variable is a normal distribution with a. mean 0 and standard deviation -1 b. mean -1 and standard deviation 0 c. mean 0 and standard deviation 1 d. mean 1 and standard deviation 0 25. Find the mean of a set of data with a standard deviation of 4, given that a value of 73 has a z-score of 1.5. a. 79 b. 61 C. 67.5 d. 67