Please answers all parts shown
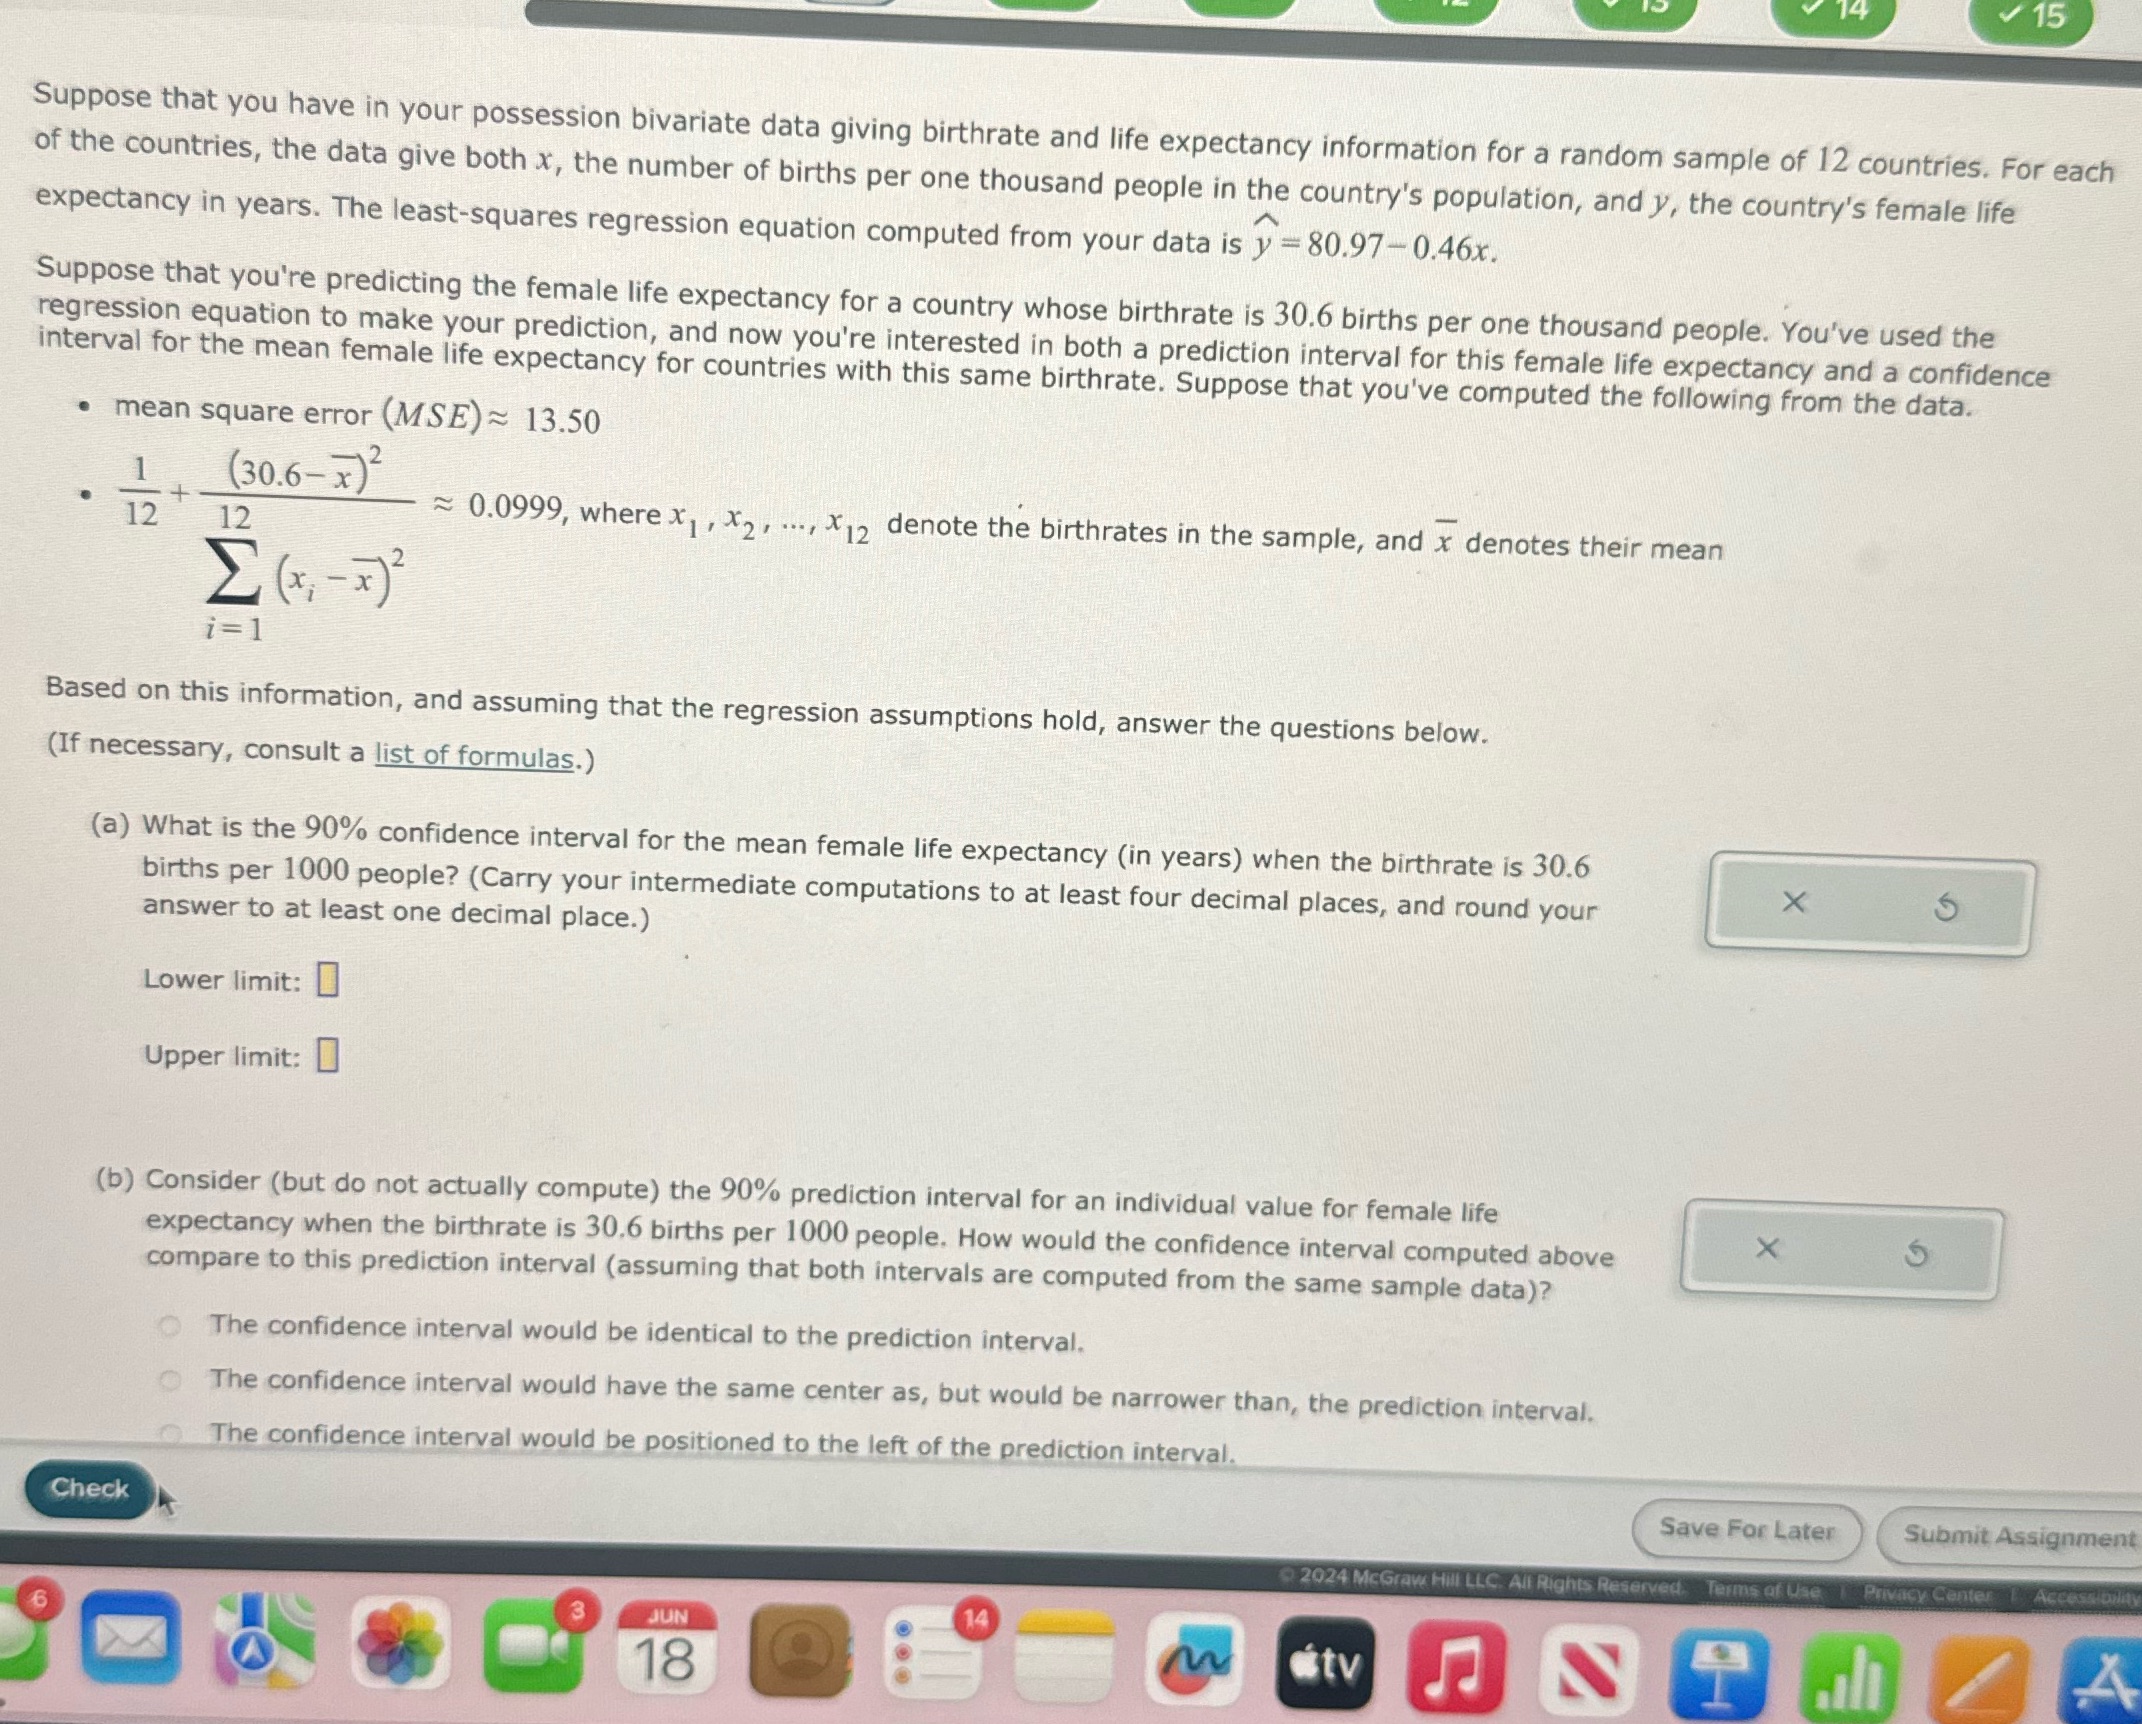
15 Suppose that you have in your possession bivariate data giving birthrate and life expectancy information for a random sample of 12 countries. For each of the countries, the data give both x, the number of births per one thousand people in the country's population, and y, the country's female life expectancy in years. The least-squares regression equation computed from your data is y = 80.97-0.46x. Suppose that you're predicting the female life expectancy for a country whose birthrate is 30.6 births per one thousand people. You've used the regression equation to make your prediction, and now you're interested in both a prediction interval for this female life expectancy and a confidence interval for the mean female life expectancy for countries with this same birthrate. Suppose that you've computed the following from the data. . mean square error (MSE) ~ 13.50 (30.6-X) 12 12 0.0999, where X ] , X2 , ..., *12 denote the birthrates in the sample, and x denotes their mean ( x, - 7) 1= 1 Based on this information, and assuming that the regression assumptions hold, answer the questions below. (If necessary, consult a list of formulas.) (a) What is the 90% confidence interval for the mean female life expectancy (in years) when the birthrate is 30.6 births per 1000 people? (Carry your intermediate computations to at least four decimal places, and round your X answer to at least one decimal place.) Lower limit: Upper limit: (b) Consider (but do not actually compute) the 90% prediction interval for an individual value for female life expectancy when the birthrate is 30.6 births per 1000 people. How would the confidence interval computed above X compare to this prediction interval (assuming that both intervals are computed from the same sample data)? The confidence interval would be identical to the prediction interval. The confidence interval would have the same center as, but would be narrower than, the prediction interval. The confidence interval would be positioned to the left of the prediction interval. Check Save For Later Submit Assignment 2024 McGraw Hill LLC. All Rights Re 6 3 Nor 18 tv 4