Please answer/show work for parts D and E for this question. (Calculate down to the third decimal points)
This was the only information that was provided to solve the problem.
The Monthly-Sales data contains monthly data from January 2016 to December 2019 for a ABC company. The first variable is Time. The second variable, Sales 1, has data on sales of a product 1. The third variable, Sales 2, has data on sales of a product 2.
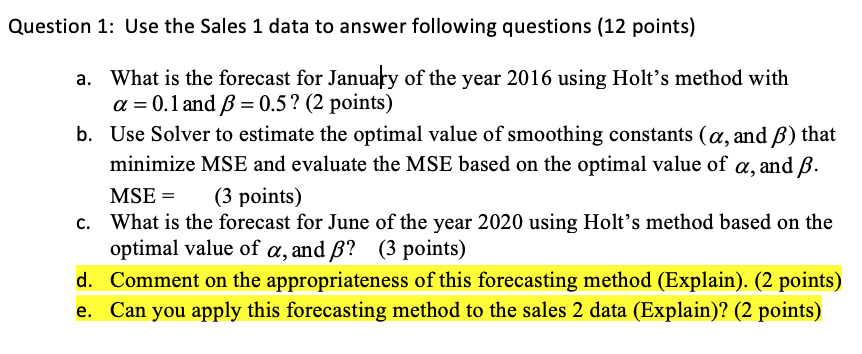
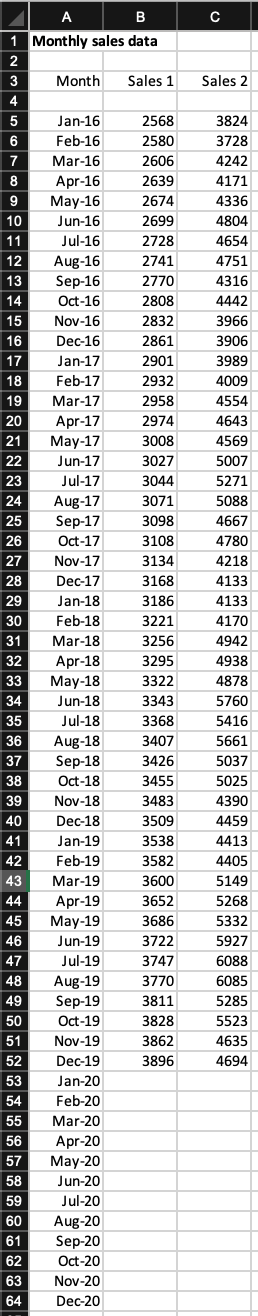
Question 1: Use the Sales 1 data to answer following questions (12 points) a. What is the forecast for January of the year 2016 using Holt's method with a=0.1 and B = 0.5? (2 points) b. Use Solver to estimate the optimal value of smoothing constants (a, and B) that minimize MSE and evaluate the MSE based on the optimal value of a, and B. MSE = (3 points) What is the forecast for June of the year 2020 using Holt's method based on the optimal value of a, and B? (3 points) d. Comment on the appropriateness of this forecasting method (Explain). (2 points) e. Can you apply this forecasting method to the sales 2 data (Explain)? (2 points) C | A B 1 Monthly sales data 3 Month Sales 1 Sales 2 7 8 10 11 12 13 14 16 17 19 20 21 22 23 25 2568 2580 2606 2639 2674 2699 2728 2741 2770 2808 2832 2861 2901 2932 2958 2974 3008 3027 3044 3071 3098 3108 3134 3168 3186 3221 3256 3295 3322 3343 3368 3407 3426 3455 3483 3509 3538 3582 3600 3652 3686 3722 3747 3770 3811 3828 3862 3896 Jan-16 Feb-16 Mar-16 Apr-16 May-16 Jun-16 Jul-16 Aug-16 Sep-16 Oct-16 Nov-16 Dec-16 Jan-17 Feb-17 Mar-17 Apr-17 May-17 Jun-17 Jul-17 Aug-17 Sep-17 Oct-17 Nov-17 Dec-17 Jan-18 Feb-18 Mar-18 Apr-18 May-18 Jun-18 Jul-18 Aug-18 Sep-18 Oct-18 Nov-18 Dec-18 Jan-19 Feb-19 Mar-19 Apr-19 May-19 Jun-19 Jul-19 Aug-19 Sep-19 Oct-19 Nov-19 Dec-19 Jan-20 Feb-20 Mar-20 Apr-20 May-20 Jun-20 Jul-20 Aug-20 Sep-20 Oct-20 Nov-20 Dec-20 3824 3728 4242 4171 4336 4804 4654 4751 4316 4442 3966 3906 3989 4009 4554 4643 4569 5007 5271 5088 4667 4780 4218 4133 4133 4170 4942 4938 4878 5760 5416 5661 5037 5025 4390 4459 4413 4405 5149 5268 5332 5927 6088 6085 5285 5523 4635 4694 31 32 33 34 36 43 50 51 53 54 55 56 58 60 61 62 63 64 Question 1: Use the Sales 1 data to answer following questions (12 points) a. What is the forecast for January of the year 2016 using Holt's method with a=0.1 and B = 0.5? (2 points) b. Use Solver to estimate the optimal value of smoothing constants (a, and B) that minimize MSE and evaluate the MSE based on the optimal value of a, and B. MSE = (3 points) What is the forecast for June of the year 2020 using Holt's method based on the optimal value of a, and B? (3 points) d. Comment on the appropriateness of this forecasting method (Explain). (2 points) e. Can you apply this forecasting method to the sales 2 data (Explain)? (2 points) C | A B 1 Monthly sales data 3 Month Sales 1 Sales 2 7 8 10 11 12 13 14 16 17 19 20 21 22 23 25 2568 2580 2606 2639 2674 2699 2728 2741 2770 2808 2832 2861 2901 2932 2958 2974 3008 3027 3044 3071 3098 3108 3134 3168 3186 3221 3256 3295 3322 3343 3368 3407 3426 3455 3483 3509 3538 3582 3600 3652 3686 3722 3747 3770 3811 3828 3862 3896 Jan-16 Feb-16 Mar-16 Apr-16 May-16 Jun-16 Jul-16 Aug-16 Sep-16 Oct-16 Nov-16 Dec-16 Jan-17 Feb-17 Mar-17 Apr-17 May-17 Jun-17 Jul-17 Aug-17 Sep-17 Oct-17 Nov-17 Dec-17 Jan-18 Feb-18 Mar-18 Apr-18 May-18 Jun-18 Jul-18 Aug-18 Sep-18 Oct-18 Nov-18 Dec-18 Jan-19 Feb-19 Mar-19 Apr-19 May-19 Jun-19 Jul-19 Aug-19 Sep-19 Oct-19 Nov-19 Dec-19 Jan-20 Feb-20 Mar-20 Apr-20 May-20 Jun-20 Jul-20 Aug-20 Sep-20 Oct-20 Nov-20 Dec-20 3824 3728 4242 4171 4336 4804 4654 4751 4316 4442 3966 3906 3989 4009 4554 4643 4569 5007 5271 5088 4667 4780 4218 4133 4133 4170 4942 4938 4878 5760 5416 5661 5037 5025 4390 4459 4413 4405 5149 5268 5332 5927 6088 6085 5285 5523 4635 4694 31 32 33 34 36 43 50 51 53 54 55 56 58 60 61 62 63 64