

Answered step by step
Verified Expert Solution
Question
1 Approved Answer
Please anwser Question 1: (25 Marks) a. Let Y, Y2, ..., Y, denote a random sample from a population with mean u and variance o.
Please anwser 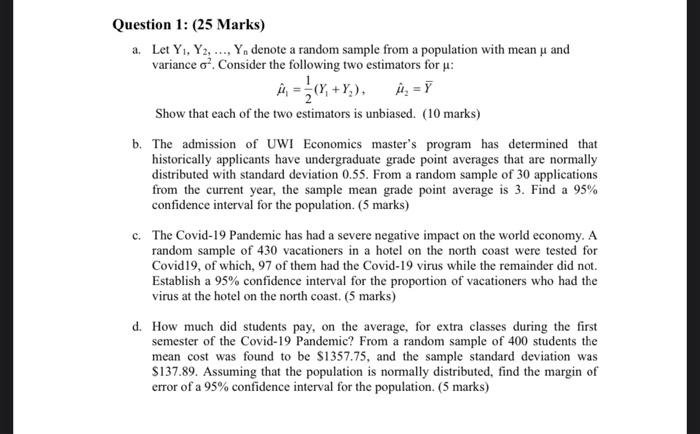
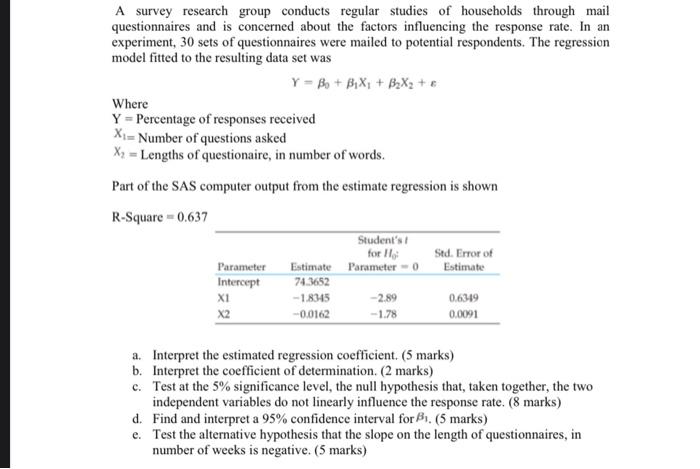
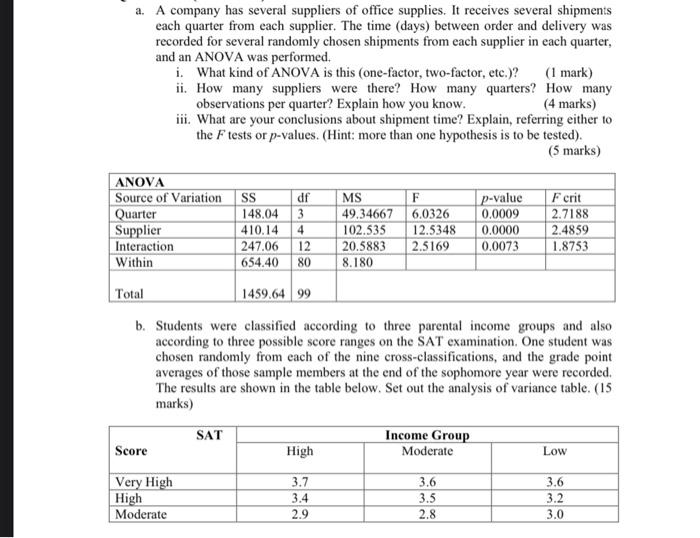
Question 1: (25 Marks) a. Let Y, Y2, ..., Y, denote a random sample from a population with mean u and variance o. Consider the following two estimators for : (%,+Y), z = 7 Show that each of the two estimators is unbiased. (10 marks) b. The admission of UWI Economics master's program has determined that historically applicants have undergraduate grade point averages that are normally distributed with standard deviation 0.55. From a random sample of 30 applications from the current year, the sample mean grade point average is 3. Find a 95% confidence interval for the population. (5 marks) c. The Covid-19 Pandemic has had a severe negative impact on the world economy. A random sample of 430 vacationers in a hotel on the north coast were tested for Covid 19, of which, 97 of them had the Covid-19 virus while the remainder did not. Establish a 95% confidence interval for the proportion of vacationers who had the virus at the hotel on the north coast. (5 marks) d. How much did students pay, on the average, for extra classes during the first semester of the Covid-19 Pandemic? From a random sample of 400 students the mean cost was found to be $1357.75, and the sample standard deviation was $137.89. Assuming that the population is normally distributed, find the margin of error of a 95% confidence interval for the population. (5 marks) A survey research group conducts regular studies of households through mail questionnaires and is concerned about the factors influencing the response rate. In an experiment, 30 sets of questionnaires were mailed to potential respondents. The regression model fitted to the resulting data set was Y = Bo + B,X, + B2X2 + 6 Where Y = Percentage of responses received X = Number of questions asked X= Lengths of questionaire, in number of words. Part of the SAS computer output from the estimate regression is shown R-Square =0.637 Student's for H Parameter Estimate Parameter - 0 Estimate Intercept 74.3652 X1 -1.8345 0.6349 X2 -0.0162 -1.78 0.0091 Std. Error of -2.89 a. Interpret the estimated regression coefficient. (5 marks) b. Interpret the coefficient of determination. (2 marks) c. Test at the 5% significance level, the null hypothesis that taken together, the two independent variables do not linearly influence the response rate. (8 marks) d. Find and interpret a 95% confidence interval for B. (5 marks) e. Test the alternative hypothesis that the slope on the length of questionnaires, in number of weeks is negative. (5 marks) a. A company has several suppliers of office supplies. It receives several shipments each quarter from each supplier. The time (days) between order and delivery was recorded for several randomly chosen shipments from each supplier in each quarter, and an ANOVA was performed. i. What kind of ANOVA is this (one-factor, two-factor, etc.)? (1 mark) ii. How many suppliers were there? How many quarters? How many observations per quarter? Explain how you know. (4 marks) iii. What are your conclusions about shipment time? Explain, referring either to the F tests or p-values. (Hint: more than one hypothesis is to be tested). (5 marks) ANOVA Source of Variation SS df MS F p-value Ferit Quarter 148.04 3 49,34667 6.0326 0.0009 2.7188 Supplier 410.14 102.535 12.5348 0.0000 2.4859 Interaction 247.06 12 20.5883 2.5169 0.0073 1.8753 Within 654.40 8.180 4 80 Total 1459.64 99 b. Students were classified according to three parental income groups and also according to three possible score ranges on the SAT examination. One student was chosen randomly from each of the nine cross-classifications, and the grade point averages of those sample members at the end of the sophomore year were recorded. The results are shown in the table below. Set out the analysis of variance table. (15 marks) SAT Income Group Score High Moderate Low Very High High Moderate mici 3.7 3.4 2.9 OA 3.6 3.5 2.8 OVO 3.6 3.2 3.0 oNa Question 1: (25 Marks) a. Let Y, Y2, ..., Y, denote a random sample from a population with mean u and variance o. Consider the following two estimators for : (%,+Y), z = 7 Show that each of the two estimators is unbiased. (10 marks) b. The admission of UWI Economics master's program has determined that historically applicants have undergraduate grade point averages that are normally distributed with standard deviation 0.55. From a random sample of 30 applications from the current year, the sample mean grade point average is 3. Find a 95% confidence interval for the population. (5 marks) c. The Covid-19 Pandemic has had a severe negative impact on the world economy. A random sample of 430 vacationers in a hotel on the north coast were tested for Covid 19, of which, 97 of them had the Covid-19 virus while the remainder did not. Establish a 95% confidence interval for the proportion of vacationers who had the virus at the hotel on the north coast. (5 marks) d. How much did students pay, on the average, for extra classes during the first semester of the Covid-19 Pandemic? From a random sample of 400 students the mean cost was found to be $1357.75, and the sample standard deviation was $137.89. Assuming that the population is normally distributed, find the margin of error of a 95% confidence interval for the population. (5 marks) A survey research group conducts regular studies of households through mail questionnaires and is concerned about the factors influencing the response rate. In an experiment, 30 sets of questionnaires were mailed to potential respondents. The regression model fitted to the resulting data set was Y = Bo + B,X, + B2X2 + 6 Where Y = Percentage of responses received X = Number of questions asked X= Lengths of questionaire, in number of words. Part of the SAS computer output from the estimate regression is shown R-Square =0.637 Student's for H Parameter Estimate Parameter - 0 Estimate Intercept 74.3652 X1 -1.8345 0.6349 X2 -0.0162 -1.78 0.0091 Std. Error of -2.89 a. Interpret the estimated regression coefficient. (5 marks) b. Interpret the coefficient of determination. (2 marks) c. Test at the 5% significance level, the null hypothesis that taken together, the two independent variables do not linearly influence the response rate. (8 marks) d. Find and interpret a 95% confidence interval for B. (5 marks) e. Test the alternative hypothesis that the slope on the length of questionnaires, in number of weeks is negative. (5 marks) a. A company has several suppliers of office supplies. It receives several shipments each quarter from each supplier. The time (days) between order and delivery was recorded for several randomly chosen shipments from each supplier in each quarter, and an ANOVA was performed. i. What kind of ANOVA is this (one-factor, two-factor, etc.)? (1 mark) ii. How many suppliers were there? How many quarters? How many observations per quarter? Explain how you know. (4 marks) iii. What are your conclusions about shipment time? Explain, referring either to the F tests or p-values. (Hint: more than one hypothesis is to be tested). (5 marks) ANOVA Source of Variation SS df MS F p-value Ferit Quarter 148.04 3 49,34667 6.0326 0.0009 2.7188 Supplier 410.14 102.535 12.5348 0.0000 2.4859 Interaction 247.06 12 20.5883 2.5169 0.0073 1.8753 Within 654.40 8.180 4 80 Total 1459.64 99 b. Students were classified according to three parental income groups and also according to three possible score ranges on the SAT examination. One student was chosen randomly from each of the nine cross-classifications, and the grade point averages of those sample members at the end of the sophomore year were recorded. The results are shown in the table below. Set out the analysis of variance table. (15 marks) SAT Income Group Score High Moderate Low Very High High Moderate mici 3.7 3.4 2.9 OA 3.6 3.5 2.8 OVO 3.6 3.2 3.0 oNa Step by Step Solution
There are 3 Steps involved in it
Step: 1

Get Instant Access to Expert-Tailored Solutions
See step-by-step solutions with expert insights and AI powered tools for academic success
Step: 2

Step: 3
Ace Your Homework with AI
Get the answers you need in no time with our AI-driven, step-by-step assistance
Get Started
Beyond Bitcoin Economics Of Digital Currencies And Blockchain Technologies
Authors: Hanna Halaburda, Miklos Sarvary, Guillaume Haeringer
2nd Edition