Question
Please assist in creating this spreadsheet. thank you. Clinic A Clinic B Clinic C Clinic D CLM 325 Excel Practice Assignment July August New Patient
Please assist in creating this spreadsheet. thank you.

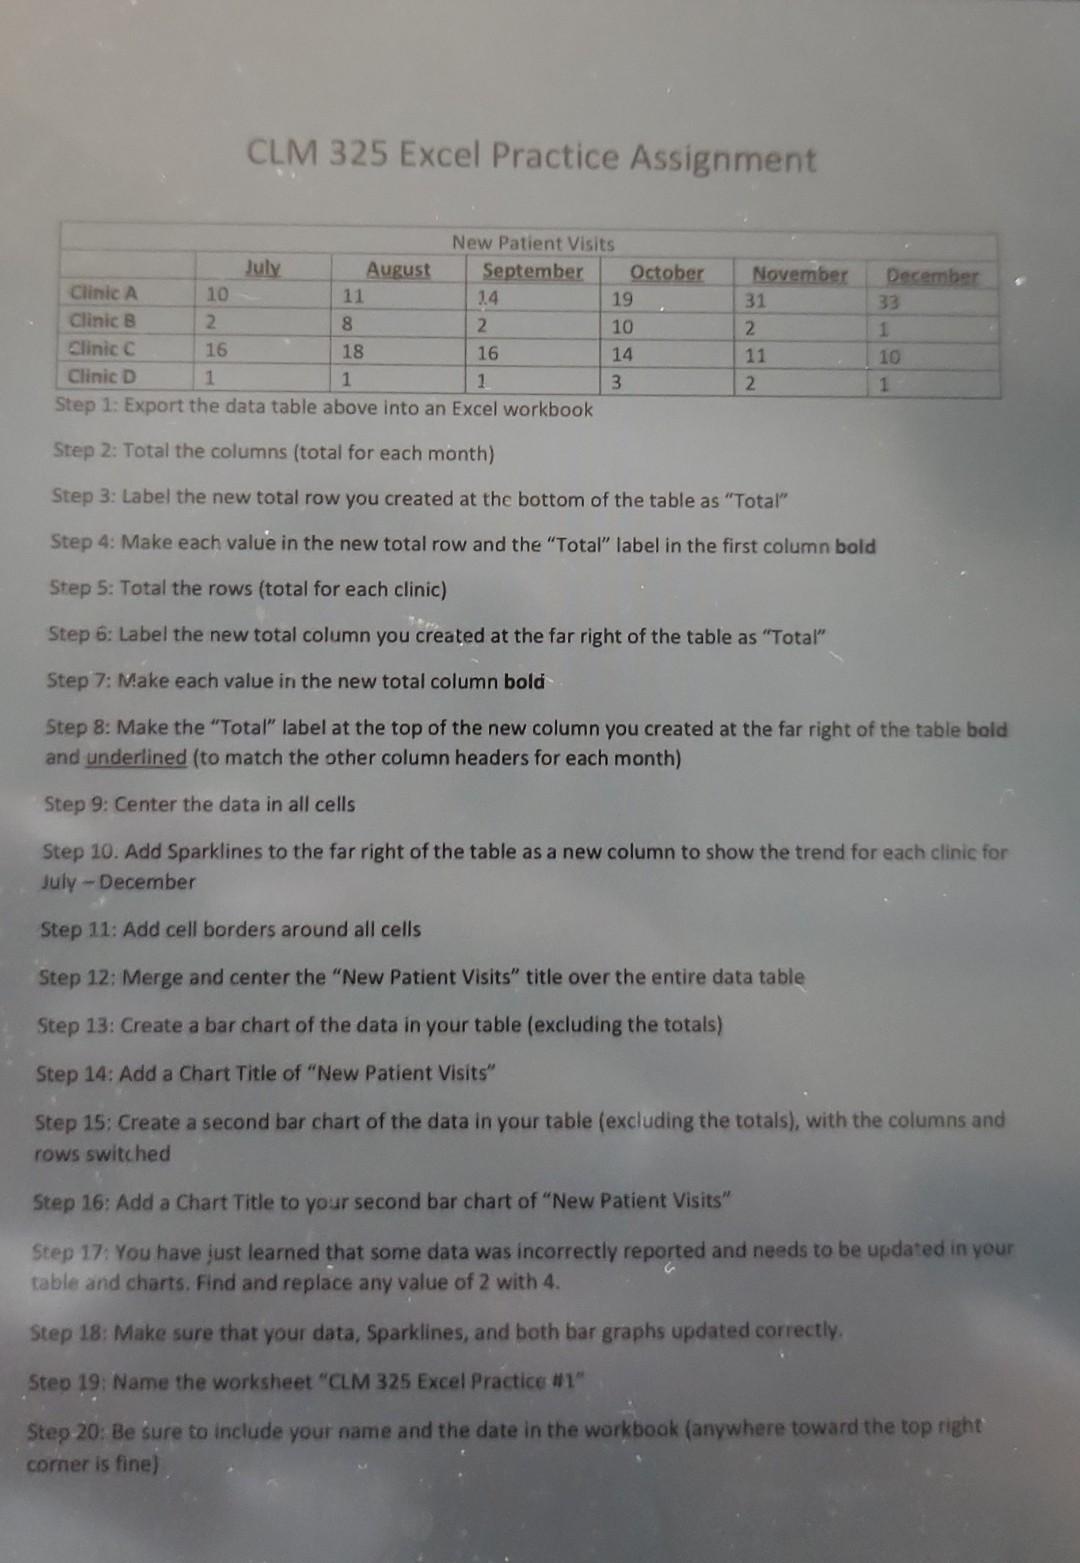
Clinic A Clinic B Clinic C Clinic D CLM 325 Excel Practice Assignment July August New Patient Visits September Step 5: Total the rows (total for each clinic) 14 10 11 2 8 16 18 16 1 1 1 Step 1: Export the data table above into an Excel workbook Step 2: Total the columns (total for each month) Step 3: Label the new total row you created at the bottom of the table as "Total" Step 4: Make each value in the new total row and the "Total" label in the first column bold October 2 November 19 10 14 3 31 2 11 2 December 33 1 10 1 ** Step 6: Label the new total column you created at the far right of the table as "Total" Step 7: Make each value in the new total column bold Step 8: Make the "Total" label at the top of the new column you created at the far right of the table boid and underlined (to match the other column headers for each month) Step 9: Center the data in all cells Step 10: Add Sparklines to the far right of the table as a new column to show the trend for each clinic for July-December Step 11: Add cell borders around all cells Step 12: Merge and center the "New Patient Visits" title over the entire data table Step 13: Create a bar chart of the data in your table (excluding the totals) Step 14: Add a Chart Title of "New Patient Visits" Step 15: Create a second bar chart of the data in your table (excluding the totals), with the columns and rows switched Step 16: Add a Chart Title to your second bar chart of "New Patient Visits" Step 17: You have just learned that some data was incorrectly reported and needs to be updated in your table and charts. Find and replace any value of 2 with 4. Step 18: Make sure that your data, Sparklines, and both bar graphs updated correctly. Step 19: Name the worksheet "CLM 325 Excel Practice #1" Step 20: Be sure to include your name and the date in the workbook (anywhere toward the top right corner is fine)
CLM 325 Excel Practice Assignment Step 2: Total the columns (total for each month) Step 3: Label the new total row you created at the bottom of the table as "Total" Step 4: Make each value in the new total row and the "Total" label in the first column bold Step 5: Total the rows (total for each clinic) Step 6: Label the new total column you created at the far right of the table as "Total" Step 7: Make each value in the new total column bold Step 8: Make the "Total" label at the top of the new column you created at the far right of the table bold and underlined (to match the other column headers for each month) Step 9: Center the data in all cells Step 10. Add Sparklines to the far right of the table as a new column to show the trend for each clinic for July - December Step 11: Add cell borders around all cells Step 12: Merge and center the "New Patient Visits" title over the entire data table Step 13: Create a bar chart of the data in your table (excluding the totals) Step 14: Add a Chart Title of "New Patient Visits" Step 15: Create a second bar chart of the data in your table (excluding the totals), with the columns and rows switched Step 16: Add a Chart Title to your second bar chart of "New Patient Visits" Step 17: You have iust learned that some data was incorrectly reported and needs to be updated in your table and charts. Find and replace any value of 2 with 4. Step 18: Make sure that your data, Sparklines, and both bar graphs updated correctly. Steo 19: Name the worksheet "CLM 325 Excel Practice \#1" Steg 20: Be sure to include your name and the date in the workbook (anywhere toward the top right corner is fine)Step by Step Solution
There are 3 Steps involved in it
Step: 1

Get Instant Access to Expert-Tailored Solutions
See step-by-step solutions with expert insights and AI powered tools for academic success
Step: 2

Step: 3

Ace Your Homework with AI
Get the answers you need in no time with our AI-driven, step-by-step assistance
Get Started


