please assist in this study guide questions as shown below
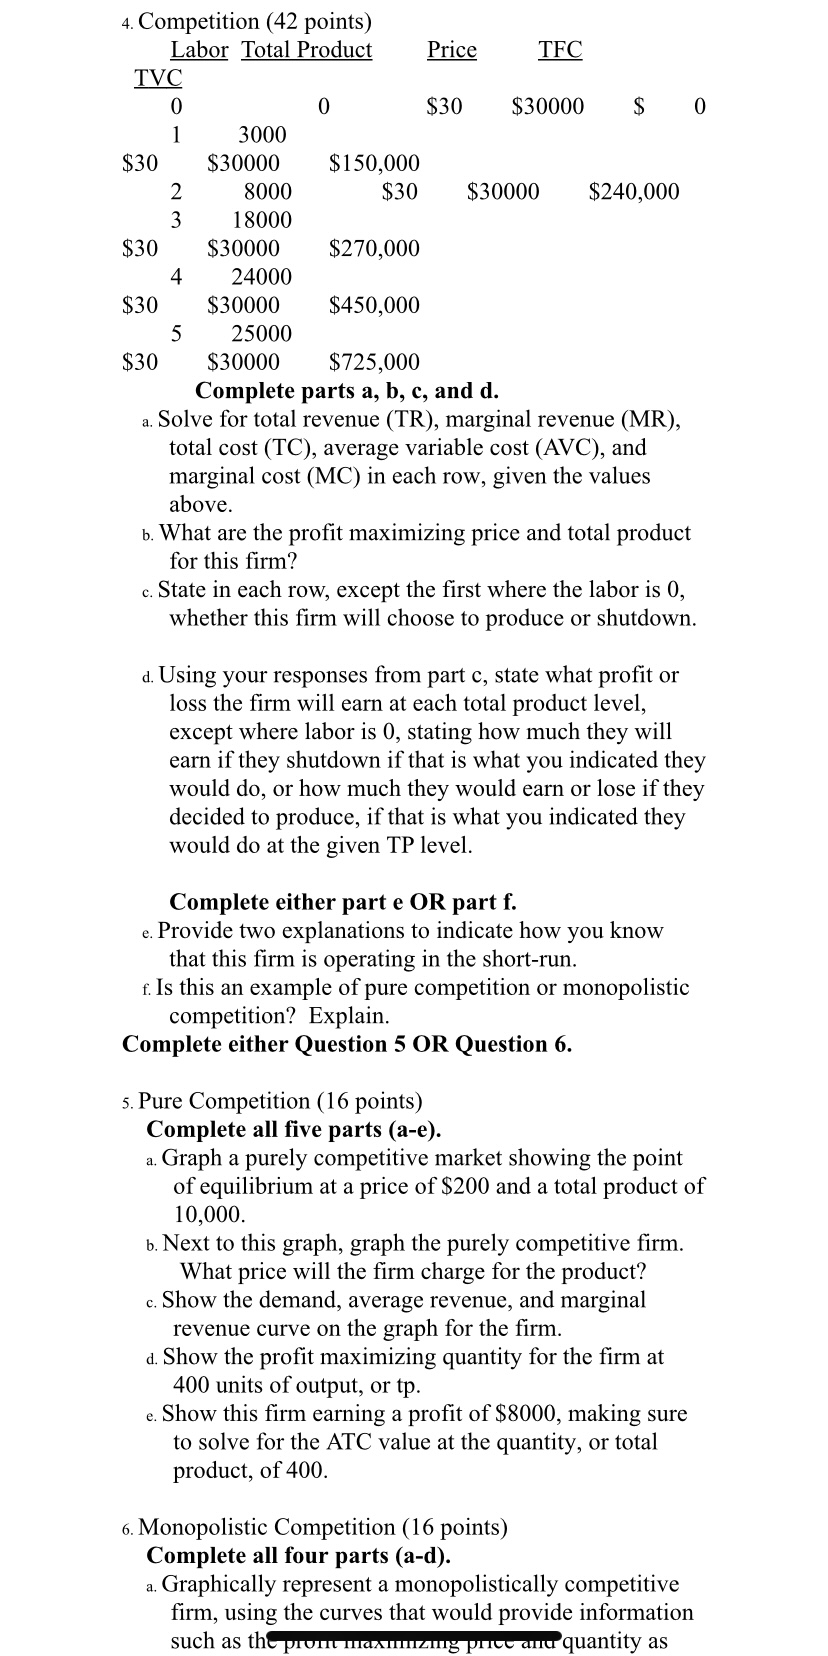
f. Is this an example of pure competition r monopolistic competition? Explain. Complete either Question 5 OR Question 6. 5. Pure Competition (16 points) Complete all five parts (a-e). a. Graph a purely competitive market showing the point of equilibrium at a price of $200 and a total product of 10,000. b. Next to this graph, graph the purely competitive firm. What price will the firm charge for the product? c. Show the demand, average revenue, and marginal revenue curve on the graph for the firm. d. Show the profit maximizing quantity for the firm at 400 units of output, or tp. e. Show this firm earning a profit of $8000, making sure to solve for the ATC value at the quantity, or total product, of 400. 6. Monopolistic Competition (16 points) Complete all four parts (a-d). a. Graphically represent a monopolistically competitive firm, using the curves that would provide information such as the profit maximizing price and quantity as well as the cost at the profit maximizing quantity. b. Show the profit maximizing price and quantity for this firm at a price of $65 and a quantity of 10000. c. Show this firm earning a profit of $50000. Make sure to solve for the numerical value for the average total cost (ATC) at the quantity of 10000. d. What will happen to the product price and average costs for this firm as it transitions from the short-run to the long-run? Extra Credit (4 points) 1. The unemployment rate for November 2020 was %. 2. The number of jobs created in November 2020 was 3. While the demand curve for the monopoly and monopolistically competitive firm appear the same, they do differ when it comes to the elasticity of both. Which one of the two demand curves will have a higher price elasticity of demand? Explain why.1. MC and AVC Relationship (6 points) What is the three-part relationship that exists between the marginal cost (MC) and average variable cost (AVC)? 2. Production Decisions (10 points) Complete parts a and b. a. Why is the decision to produce or shutdown made during the short-run only? b. When deciding whether to produce or shutdown, besides comparing the profits/losses earned from producing versus the losses suffered by shutting down, what two other measures are compared? Why are these two measures selected for comparison? Complete either part c OR part d c. How does a firm know, graphically, when it is producing above cost? d. Why would a firm choose to increase production when marginal revenue is greater than marginal cost? 3. Competition (26 points) Complete parts a and b. a. Which type(s) of industry competition, of the four studied, displayed allocationefficiency? Does allocationefficiency exist in the short-run, long-run, or both? b. How does a monopolist or monopolistically competitive firm determine graphically if the demand for its product is elastic, unit elastic or inelastic? Why does it want to operate where demand is elastic? Complete either parts c and d OR parts e and f. c. How is price determined, graphically, for the monopoly and monopolistically competitive firm? Why is it different for these two compared to how the purely competitive firm determines its price? In your response, explain how the price is set for the purely competitive firm. d. Which of the four forms of industry competition have advertising? Why is advertising experienced in this/these form(s) of competition and not experienced in the other form(s) of competition? e. Which type(s) of industry competition exhibits mutual interdependence? Why is it experienced in this type(s) of industry competition and not the other type(s)? f. Why does monopolistic competition exhibit excess capacity? What type of efficiency is not being realized because of it? To achieve this type of efficiency, what should happen to the number of firms within this industry? 4. Competition (42 points)4. Competition (42 points) Labor Total Product Price TFC TVC 0 0 $30 $30000 $ 0 l 3000 $30 $30000 $150,000 2 8000 $30 $30000 $240,000 3 18000 $30 $30000 $270,000 4 24000 $30 $30000 $450,000 5 25000 $30 $30000 $725,000 Complete parts a, b, e, and d. a. Solve for total revenue (TR), marginal revenue (MR), total cost (TC), average variable cost (AVC), and marginal cost (MC) in each row, given the values above. b. What are the prot maximizing price and total product for this rm? e. State in each row, except the rst where the labor is 0, whether this rm will choose to produce or shutdown. d. Using your responses from part c, state what prot or loss the rm will earn at each total product level, except where labor is 0, stating how much they will earn if they shutdown if that is what you indicated they would do, or how much they would earn or lose if they decided to produce, if that is what you indicated they would do at the given TP level. Complete either part e 0R part 1'. e. Provide two explanations to indicate how you know that this rm is operating in the short-run. r. Is this an example of pure competition or monopolistic competition? Explain. Complete either Question 5 OR Question 6. s. Pure Competition (16 points) Complete all five parts (a-e). a. Graph a purely competitive market showing the point of equilibrium at a price of $200 and a total product of 10,000. b. Next to this graph, graph the purely competitive rm. What price will the rm charge for the product? c. Show the demand, average revenue, and marginal revenue curve on the graph for the rm. d. Show the prot maximizing quantity for the rm at 400 units of output, or tp. e. Show this rm earning a prot of $8000, making sure to solve for the ATC value at the quantity, or total product, of 400. 6. Monopolistic Competition (16 points) Complete all four parts (a-d). a. Graphically represent a monopolistically competitive rm, using the curves that would provide information such as tthuantity as