Answered step by step
Verified Expert Solution
Link Copied!

Question

1 Approved Answer

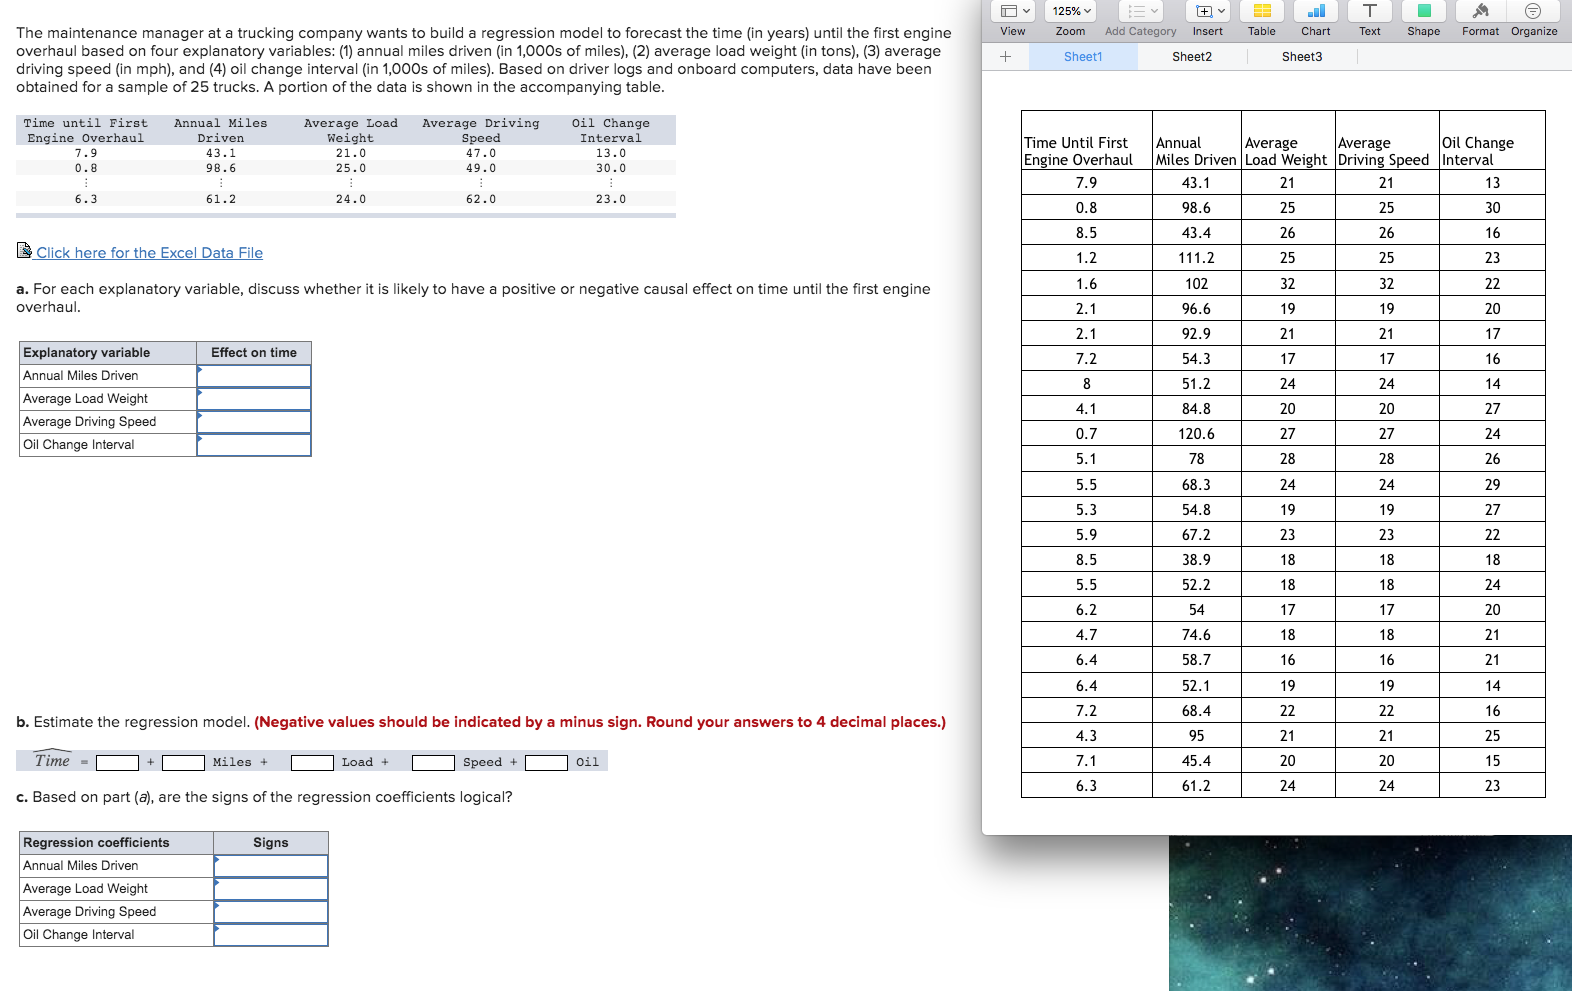
please assist me 125% Ev The maintenance manager at a trucking company wants to build a regression model to forecast the time (in years) until

please assist me

image text in transcribed
125% Ev The maintenance manager at a trucking company wants to build a regression model to forecast the time (in years) until the first engine T M View overhaul based on four explanatory variables: (1) annual miles driven (in 1,000s of miles), (2) average load weight (in tons), (3) average Zoom Add Category Insert Table Chart Text Shape Format Organize driving speed (in mph), and (4) oil change interval (in 1,000s of miles). Based on driver logs and onboard computers, data have been + Sheet Sheet2 Sheet3 obtained for a sample of 25 trucks. A portion of the data is shown in the accompanying table. Time until First Engine Overhaul Annual Miles Average Load Driven Weight Average Driving Oil Change 7.9 Speed 43. 1 Interval 21.0 47. 13.0 Time Until First U . 8 98.6 25. 49.0 30.0 Engine Overhaul Annual Average Average Miles Driven Load Weight Driving Speed Interval Oil Change 6.3 61.2 24.0 62.0 23.0 7.9 13.1 21 21 13 0.8 98.6 25 25 30 Click here for the Excel Data File 8.5 43.4 26 26 16 1.2 111.2 25 25 23 overhaul. a. For each explanatory variable, discuss whether it is likely to have a positive or negative causal effect on time until the first engine 1.6 102 32 32 22 2.1 96.6 19 19 20 Explanatory variable Effect on time 2.1 92.9 21 21 17 Annual Miles Driven 7.2 54.3 17 17 16 Average Load Weight 8 1.2 24 24 14 Average Driving Speed 4. 1 34.8 20 20 27 Oil Change Interva 0.7 120.6 27 27 24 5.1 78 28 28 26 5.5 68.3 24 24 29 5.3 54.8 19 19 27 5.9 67.2 23 23 22 8.5 38.9 18 18 18 5.5 2.2 18 18 24 6.2 54 17 17 20 4.7 74.6 18 18 21 6.4 58.7 16 16 21 6.4 52.1 19 19 14 b. Estimate the regression model. (Negative values should be indicated by a minus sign. Round your answers to 4 decimal places.) 7.2 58.4 22 22 16 Time =+ Miles + 4.3 95 21 Load + Speed + oil 21 25 7.1 45.4 20 20 15 c. Based on part (a), are the signs of the regression coefficients logical? 6.3 1.2 24 24 23 Regression coefficients Signs Annual Miles Driven Average Load Weight Average Driving Speed Oil Change Interval

Step by Step Solution

There are 3 Steps involved in it

Step: 1

blur-text-image

Get Instant Access to Expert-Tailored Solutions

See step-by-step solutions with expert insights and AI powered tools for academic success

Step: 2

blur-text-image

Step: 3

blur-text-image

Ace Your Homework with AI

Get the answers you need in no time with our AI-driven, step-by-step assistance

Get Started

Recommended Textbook for

More Books

Students also viewed these Mathematics questions