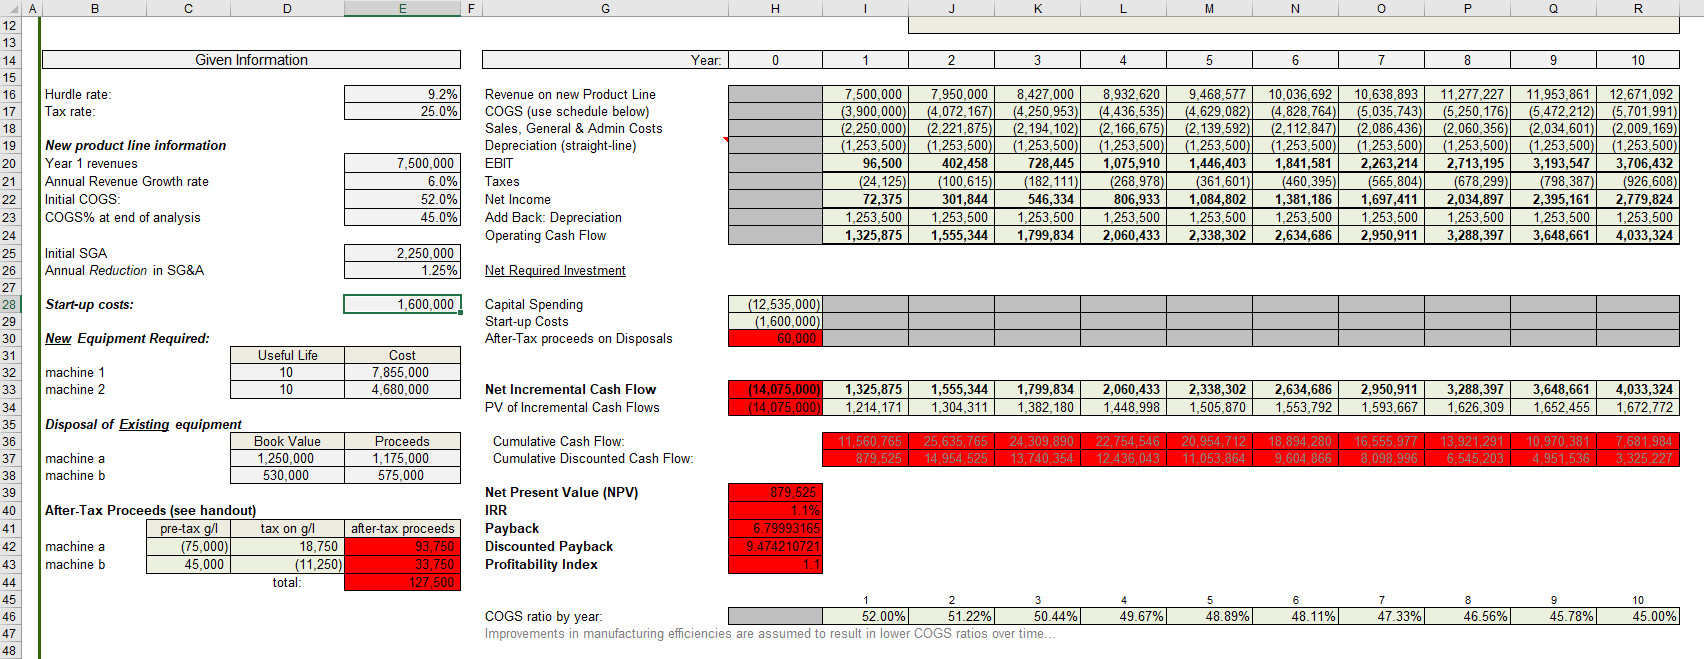
 PLEASE ASSIST, the person who previously answered it gave the wrong formulas for the cells that are turned red. everything else is correct according to the macro grading on the file. PLEASE PROVIDE CORRECT NUMBERS AND EXCEL FORMULAS FOR THE RED CELLS! :) thank you!
B D H L M N o Q R Given Information Year: 0 1 2 3 4 5 6 7 8 9 10 Hurdle rate Tax rate: 9.2% 25.0% New product line information Year 1 revenues Annual Revenue Growth rate Initial COGS COGS% at end of analysis 7,500,000 6.0% 52.0% 45.0% Revenue on new Product Line COGS (use schedule below) Sales, General & Admin Costs Depreciation (straight-line) EBIT Taxes Net Income Add Back: Depreciation Operating Cash Flow 7,500,000 (3,900.000) (2,250,000) (1,253,500 96,500 (24, 125) 72,375 1,253,500 1,325,875 7,950,000 (4,072,167) (2,221,875) (1,253,500) 402,458 (100,615) 301,844 1,253,500 1,555,344 8,427,000 (4,250,953) (2,194,102) (1,253,500) 728,445 (182, 111) 546,334 1,253,500 1,799,834 8,932,620 (4.436.535) (2,166,675) (1,253,500) 1,075,910 (268,978) 806,933 1,253,500 2,060,433 9,468,577 (4,629,082) (2,139,592) (1,253,500) 1,446,403 (361,601) 1,084,802 1,253,500 2,338,302 10,036,692 (4,828,764 (2,112,847 (1,253,500) 1,841,581 (460,395) 1,381,186 1,253,500 2,634,686 10,638,893 (5,035,743) (2,086,436) (1,253,500) 2,263,214 (565,804) 1,697,411 1,253,500 2,950,911 11,277,227 (5,250,176) (2,060,356) (1,253,500) 2,713,195 (678,299 2,034,897 1,253,500 3,288,397 11,953,861 (5,472,212) (2,034,601) (1,253,500) 3,193,547 (798,387) 2,395,161 1,253,500 3,648,661 12,671,092 (5,701,991) (2,009, 169) (1,253,500) 3,706,432 (926,608) 2,779,824 1,253,500 4,033,324 Initial SGA Annual Reduction in SG&A 2,250,000 1.25% Net Required Investment Start-up costs: 1,600,000 12 13 14 15 16 17 18 19 20 21 22 23 24 25 26 27 28 29 30 31 32 33 34 35 36 37 38 39 40 41 42 43 44 45 46 47 48 Capital Spending Start-up Costs After-Tax proceeds on Disposals (12,535,000) (1,600,000) 60,000 New Equipment Required: machine 1 machine 2 Useful Life 10 10 Cost 7,855,000 4,680,000 Net Incremental Cash Flow PV of Incremental Cash Flows (14,075,000) (14,075,000 1,325,875 1,214,171 1,555,344 1,304,311 1,799,834 1,382, 180 2,060,433 1,448,998 2,338,302 1,505,870 2,634,686 1,553,792 2,950.911 1,593,667 3,288,397 1,626,309 3,648,661 1,652.455 4,033,324 1,672,772 Disposal of Existing equipment Book Value machine a 1,250,000 machine b 530,000 Proceeds 1,175,000 575,000 Cumulative Cash Flow: Cumulative Discounted Cash Flow: 11,560,765 879,525 25,635,765 14,954,525 24.309.890 13,740,354 22,754,546 12,436,043 20,954,712 11,053,864 18,894,280 9,604,866 16,555,977 8,098,996 13,921,291 6,545,203 10,970,381 4,951,536 7,681,984 3,325,227 After-Tax Proceeds (see handout) pre-tax g/l tax on g/l machine a (75,000) 18.750 machine b 45,000 (11,250) total Net Present Value (NPV) IRR Payback Discounted Payback Profitability Index 879,525 1.1% 6.79993165 9.474210721 after-tax proceeds 93,750 33,750 127,500 1 2 3 COGS ratio by year 52.00% 51.22% 50.44% Improvements in manufacturing efficiencies are assumed to result in lower COGS ratios over time. 49.67% 5 48.89% 6 48.11% 7 47.33% 8 46.56% 9 45.78% 10 45.00% B D H L M N o Q R Given Information Year: 0 1 2 3 4 5 6 7 8 9 10 Hurdle rate Tax rate: 9.2% 25.0% New product line information Year 1 revenues Annual Revenue Growth rate Initial COGS COGS% at end of analysis 7,500,000 6.0% 52.0% 45.0% Revenue on new Product Line COGS (use schedule below) Sales, General & Admin Costs Depreciation (straight-line) EBIT Taxes Net Income Add Back: Depreciation Operating Cash Flow 7,500,000 (3,900.000) (2,250,000) (1,253,500 96,500 (24, 125) 72,375 1,253,500 1,325,875 7,950,000 (4,072,167) (2,221,875) (1,253,500) 402,458 (100,615) 301,844 1,253,500 1,555,344 8,427,000 (4,250,953) (2,194,102) (1,253,500) 728,445 (182, 111) 546,334 1,253,500 1,799,834 8,932,620 (4.436.535) (2,166,675) (1,253,500) 1,075,910 (268,978) 806,933 1,253,500 2,060,433 9,468,577 (4,629,082) (2,139,592) (1,253,500) 1,446,403 (361,601) 1,084,802 1,253,500 2,338,302 10,036,692 (4,828,764 (2,112,847 (1,253,500) 1,841,581 (460,395) 1,381,186 1,253,500 2,634,686 10,638,893 (5,035,743) (2,086,436) (1,253,500) 2,263,214 (565,804) 1,697,411 1,253,500 2,950,911 11,277,227 (5,250,176) (2,060,356) (1,253,500) 2,713,195 (678,299 2,034,897 1,253,500 3,288,397 11,953,861 (5,472,212) (2,034,601) (1,253,500) 3,193,547 (798,387) 2,395,161 1,253,500 3,648,661 12,671,092 (5,701,991) (2,009, 169) (1,253,500) 3,706,432 (926,608) 2,779,824 1,253,500 4,033,324 Initial SGA Annual Reduction in SG&A 2,250,000 1.25% Net Required Investment Start-up costs: 1,600,000 12 13 14 15 16 17 18 19 20 21 22 23 24 25 26 27 28 29 30 31 32 33 34 35 36 37 38 39 40 41 42 43 44 45 46 47 48 Capital Spending Start-up Costs After-Tax proceeds on Disposals (12,535,000) (1,600,000) 60,000 New Equipment Required: machine 1 machine 2 Useful Life 10 10 Cost 7,855,000 4,680,000 Net Incremental Cash Flow PV of Incremental Cash Flows (14,075,000) (14,075,000 1,325,875 1,214,171 1,555,344 1,304,311 1,799,834 1,382, 180 2,060,433 1,448,998 2,338,302 1,505,870 2,634,686 1,553,792 2,950.911 1,593,667 3,288,397 1,626,309 3,648,661 1,652.455 4,033,324 1,672,772 Disposal of Existing equipment Book Value machine a 1,250,000 machine b 530,000 Proceeds 1,175,000 575,000 Cumulative Cash Flow: Cumulative Discounted Cash Flow: 11,560,765 879,525 25,635,765 14,954,525 24.309.890 13,740,354 22,754,546 12,436,043 20,954,712 11,053,864 18,894,280 9,604,866 16,555,977 8,098,996 13,921,291 6,545,203 10,970,381 4,951,536 7,681,984 3,325,227 After-Tax Proceeds (see handout) pre-tax g/l tax on g/l machine a (75,000) 18.750 machine b 45,000 (11,250) total Net Present Value (NPV) IRR Payback Discounted Payback Profitability Index 879,525 1.1% 6.79993165 9.474210721 after-tax proceeds 93,750 33,750 127,500 1 2 3 COGS ratio by year 52.00% 51.22% 50.44% Improvements in manufacturing efficiencies are assumed to result in lower COGS ratios over time. 49.67% 5 48.89% 6 48.11% 7 47.33% 8 46.56% 9 45.78% 10 45.00%
 PLEASE ASSIST, the person who previously answered it gave the wrong formulas for the cells that are turned red. everything else is correct according to the macro grading on the file. PLEASE PROVIDE CORRECT NUMBERS AND EXCEL FORMULAS FOR THE RED CELLS! :) thank you!


