Please assist with EXCEL answers of the below. More information in the tables provided
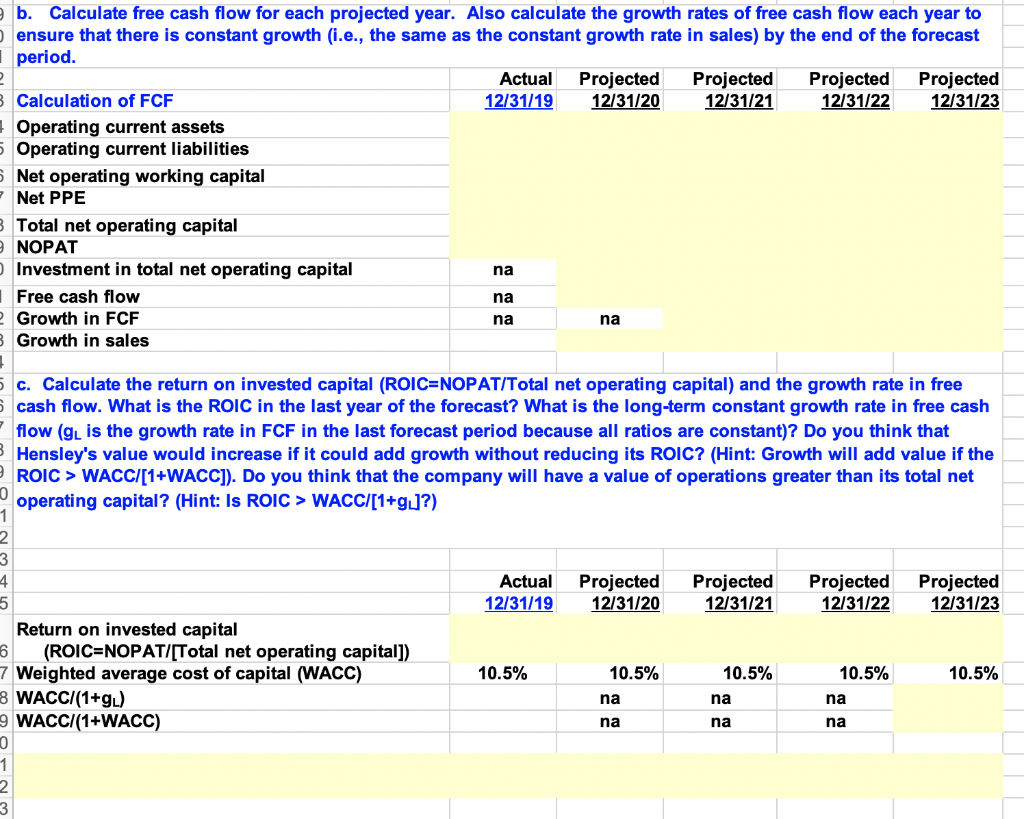
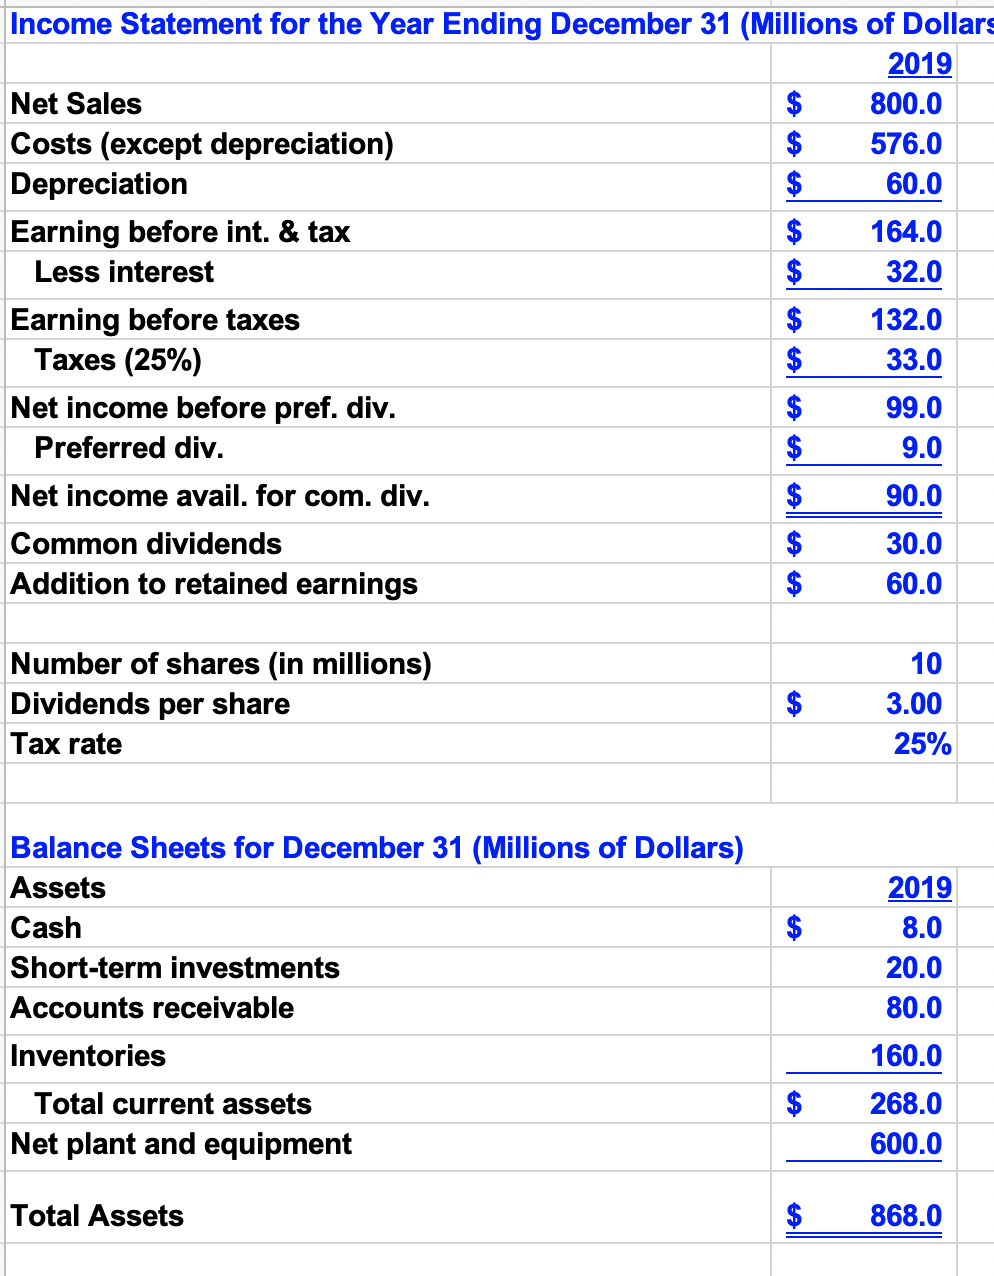
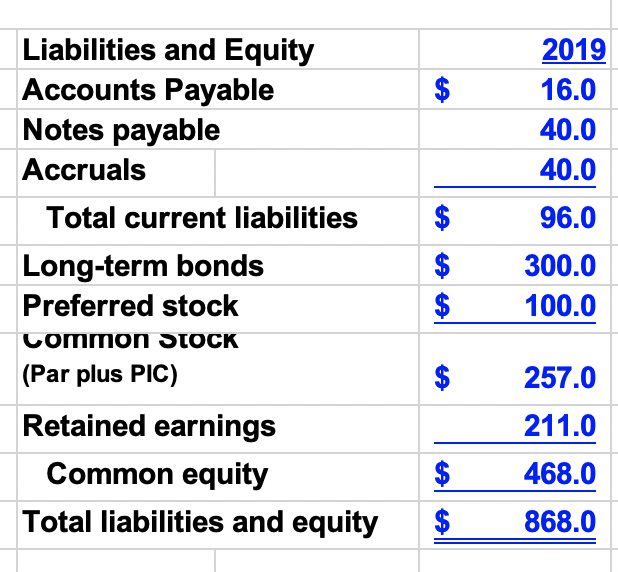
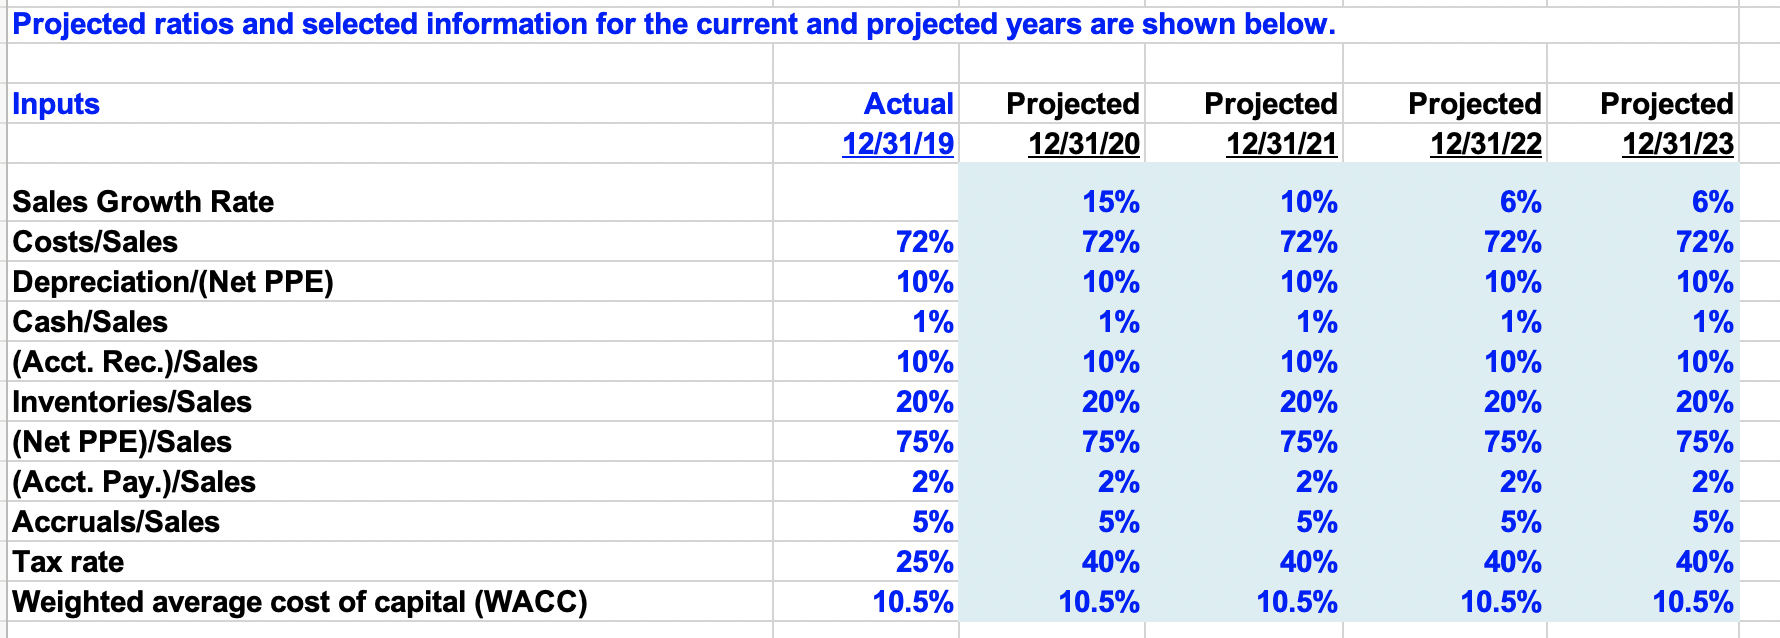
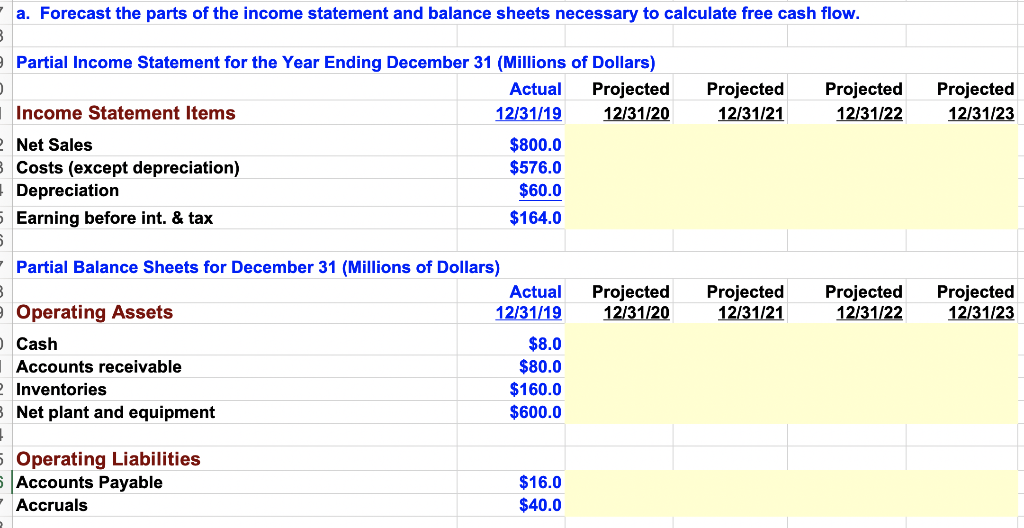
b. Calculate free cash flow for each projected year. Also calculate the growth rates of free cash flow each year to ensure that there is constant growth (i.e., the same as the constant growth rate in sales) by the end of the forecast period. Actual Projected Projected Projected Projected Calculation of FCF 12/31/19 12/31/20 12/31/21 12/31/22 12/31/23 Operating current assets Operating current liabilities Net operating working capital Net PPE 3 Total net operating capital NOPAT Investment in total net operating capital Free cash flow 2 Growth in FCF na na Growth in sales na na 5 c. Calculate the return on invested capital (ROIC=NOPAT/Total net operating capital) and the growth rate in free cash flow. What is the ROIC in the last year of the forecast? What is the long-term constant growth rate in free cash flow (9L is the growth rate in FCF in the last forecast period because all ratios are constant)? Do you think that Hensley's value would increase if it could add growth without reducing its ROIC? (Hint: Growth will add value if the ROIC > WACC/(1+WACC]). Do you think that the company will have a value of operations greater than its total net operating capital? (Hint: Is ROIC > WACC/[1+g]?) Actual 12/31/19 Projected 12/31/20 Projected 12/31/21 Projected 12/31/22 Projected 12/31/23 2 3 4 5 Return on invested capital (ROICENOPAT/[Total net operating capital]) 7 Weighted average cost of capital (WACC) 3 WACCI(1+g.) 9 WACCI(1+WACC) 0 10.5% 10.5% 10.5% 10.5% 10.5% na na na na na na 2 3 Income Statement for the Year Ending December 31 (Millions of Dollars 2019 Net Sales $ 800.0 Costs (except depreciation) $ 576.0 Depreciation $ 60.0 Earning before int. & tax $ 164.0 Less interest $ 32.0 Earning before taxes $ 132.0 Taxes (25%) $ 33.0 Net income before pref. div. 99.0 Preferred div. 9.0 Net income avail. for com. div. $ 90.0 Common dividends $ 30.0 Addition to retained earnings $ 60.0 Number of shares (in millions) Dividends per share Tax rate $ 10 3.00 25% $ Balance Sheets for December 31 (Millions of Dollars) Assets Cash Short-term investments Accounts receivable Inventories 2019 8.0 20.0 80.0 160.0 Total current assets Net plant and equipment 268.0 600.0 Total Assets 868.0 $ 2019 16.0 40.0 40.0 Liabilities and Equity Accounts Payable Notes payable Accruals Total current liabilities Long-term bonds Preferred stock Common STOCK (Par plus PIC) 96.0 $ $ 300.0 100.0 $ $ 257.0 211.0 Retained earnings Common equity Total liabilities and equity $ 468.0 $ 868.0 Projected ratios and selected information for the current and projected years are shown below. Inputs Actual 12/31/19 Projected 12/31/20 Projected 12/31/21 Projected 12/31/22 Projected 12/31/23 Sales Growth Rate Costs/Sales Depreciation/(Net PPE) Cash/Sales (Acct. Rec.)/Sales Inventories/Sales (Net PPE)/Sales (Acct. Pay.)/Sales Accruals/Sales Tax rate Weighted average cost of capital (WACC) 72% 10% 1% 10% 20% 75% 2% 5% 25% 10.5% 15% 72% 10% 1% 10% 20% 75% 2% 5% 40% 10.5% 10% 72% 10% 1% 10% 20% 75% 2% 5% 40% 10.5% 6% 72% 10% 1% 10% 20% 75% 2% 5% 40% 10.5% 6% 72% 10% 1% 10% 20% 75% 2% 5% 40% 10.5% a. Forecast the parts of the income statement and balance sheets necessary to calculate free cash flow. Projected 12/31/21 Projected 12/31/22 Projected 12/31/23 Partial Income Statement for the Year Ending December 31 (Millions of Dollars) Actual Projected Income Statement Items 12/31/19 12/31/20 Net Sales $800.0 Costs (except depreciation) $576.0 Depreciation $60.0 5 Earning before int. & tax $164.0 Projected 12/31/20 Projected 12/31/21 Projected 12/31/22 Projected 12/31/23 Partial Balance Sheets for December 31 (Millions of Dollars) Actual Operating Assets 12/31/19 Cash $8.0 Accounts receivable $80.0 Inventories $160.0 3 Net plant and equipment $600.0 Operating Liabilities Accounts Payable Accruals $16.0 $40.0 b. Calculate free cash flow for each projected year. Also calculate the growth rates of free cash flow each year to ensure that there is constant growth (i.e., the same as the constant growth rate in sales) by the end of the forecast period. Actual Projected Projected Projected Projected Calculation of FCF 12/31/19 12/31/20 12/31/21 12/31/22 12/31/23 Operating current assets Operating current liabilities Net operating working capital Net PPE 3 Total net operating capital NOPAT Investment in total net operating capital Free cash flow 2 Growth in FCF na na Growth in sales na na 5 c. Calculate the return on invested capital (ROIC=NOPAT/Total net operating capital) and the growth rate in free cash flow. What is the ROIC in the last year of the forecast? What is the long-term constant growth rate in free cash flow (9L is the growth rate in FCF in the last forecast period because all ratios are constant)? Do you think that Hensley's value would increase if it could add growth without reducing its ROIC? (Hint: Growth will add value if the ROIC > WACC/(1+WACC]). Do you think that the company will have a value of operations greater than its total net operating capital? (Hint: Is ROIC > WACC/[1+g]?) Actual 12/31/19 Projected 12/31/20 Projected 12/31/21 Projected 12/31/22 Projected 12/31/23 2 3 4 5 Return on invested capital (ROICENOPAT/[Total net operating capital]) 7 Weighted average cost of capital (WACC) 3 WACCI(1+g.) 9 WACCI(1+WACC) 0 10.5% 10.5% 10.5% 10.5% 10.5% na na na na na na 2 3 Income Statement for the Year Ending December 31 (Millions of Dollars 2019 Net Sales $ 800.0 Costs (except depreciation) $ 576.0 Depreciation $ 60.0 Earning before int. & tax $ 164.0 Less interest $ 32.0 Earning before taxes $ 132.0 Taxes (25%) $ 33.0 Net income before pref. div. 99.0 Preferred div. 9.0 Net income avail. for com. div. $ 90.0 Common dividends $ 30.0 Addition to retained earnings $ 60.0 Number of shares (in millions) Dividends per share Tax rate $ 10 3.00 25% $ Balance Sheets for December 31 (Millions of Dollars) Assets Cash Short-term investments Accounts receivable Inventories 2019 8.0 20.0 80.0 160.0 Total current assets Net plant and equipment 268.0 600.0 Total Assets 868.0 $ 2019 16.0 40.0 40.0 Liabilities and Equity Accounts Payable Notes payable Accruals Total current liabilities Long-term bonds Preferred stock Common STOCK (Par plus PIC) 96.0 $ $ 300.0 100.0 $ $ 257.0 211.0 Retained earnings Common equity Total liabilities and equity $ 468.0 $ 868.0 Projected ratios and selected information for the current and projected years are shown below. Inputs Actual 12/31/19 Projected 12/31/20 Projected 12/31/21 Projected 12/31/22 Projected 12/31/23 Sales Growth Rate Costs/Sales Depreciation/(Net PPE) Cash/Sales (Acct. Rec.)/Sales Inventories/Sales (Net PPE)/Sales (Acct. Pay.)/Sales Accruals/Sales Tax rate Weighted average cost of capital (WACC) 72% 10% 1% 10% 20% 75% 2% 5% 25% 10.5% 15% 72% 10% 1% 10% 20% 75% 2% 5% 40% 10.5% 10% 72% 10% 1% 10% 20% 75% 2% 5% 40% 10.5% 6% 72% 10% 1% 10% 20% 75% 2% 5% 40% 10.5% 6% 72% 10% 1% 10% 20% 75% 2% 5% 40% 10.5% a. Forecast the parts of the income statement and balance sheets necessary to calculate free cash flow. Projected 12/31/21 Projected 12/31/22 Projected 12/31/23 Partial Income Statement for the Year Ending December 31 (Millions of Dollars) Actual Projected Income Statement Items 12/31/19 12/31/20 Net Sales $800.0 Costs (except depreciation) $576.0 Depreciation $60.0 5 Earning before int. & tax $164.0 Projected 12/31/20 Projected 12/31/21 Projected 12/31/22 Projected 12/31/23 Partial Balance Sheets for December 31 (Millions of Dollars) Actual Operating Assets 12/31/19 Cash $8.0 Accounts receivable $80.0 Inventories $160.0 3 Net plant and equipment $600.0 Operating Liabilities Accounts Payable Accruals $16.0 $40.0