please assist with question 10 part C & D.
excel with info: https://docs.google.com/spreadsheets/d/1HqrxXMkOxNqTi0XUHBUDEGqz6DIr5ObYR_NazqiVw7g/edit?usp=sharing
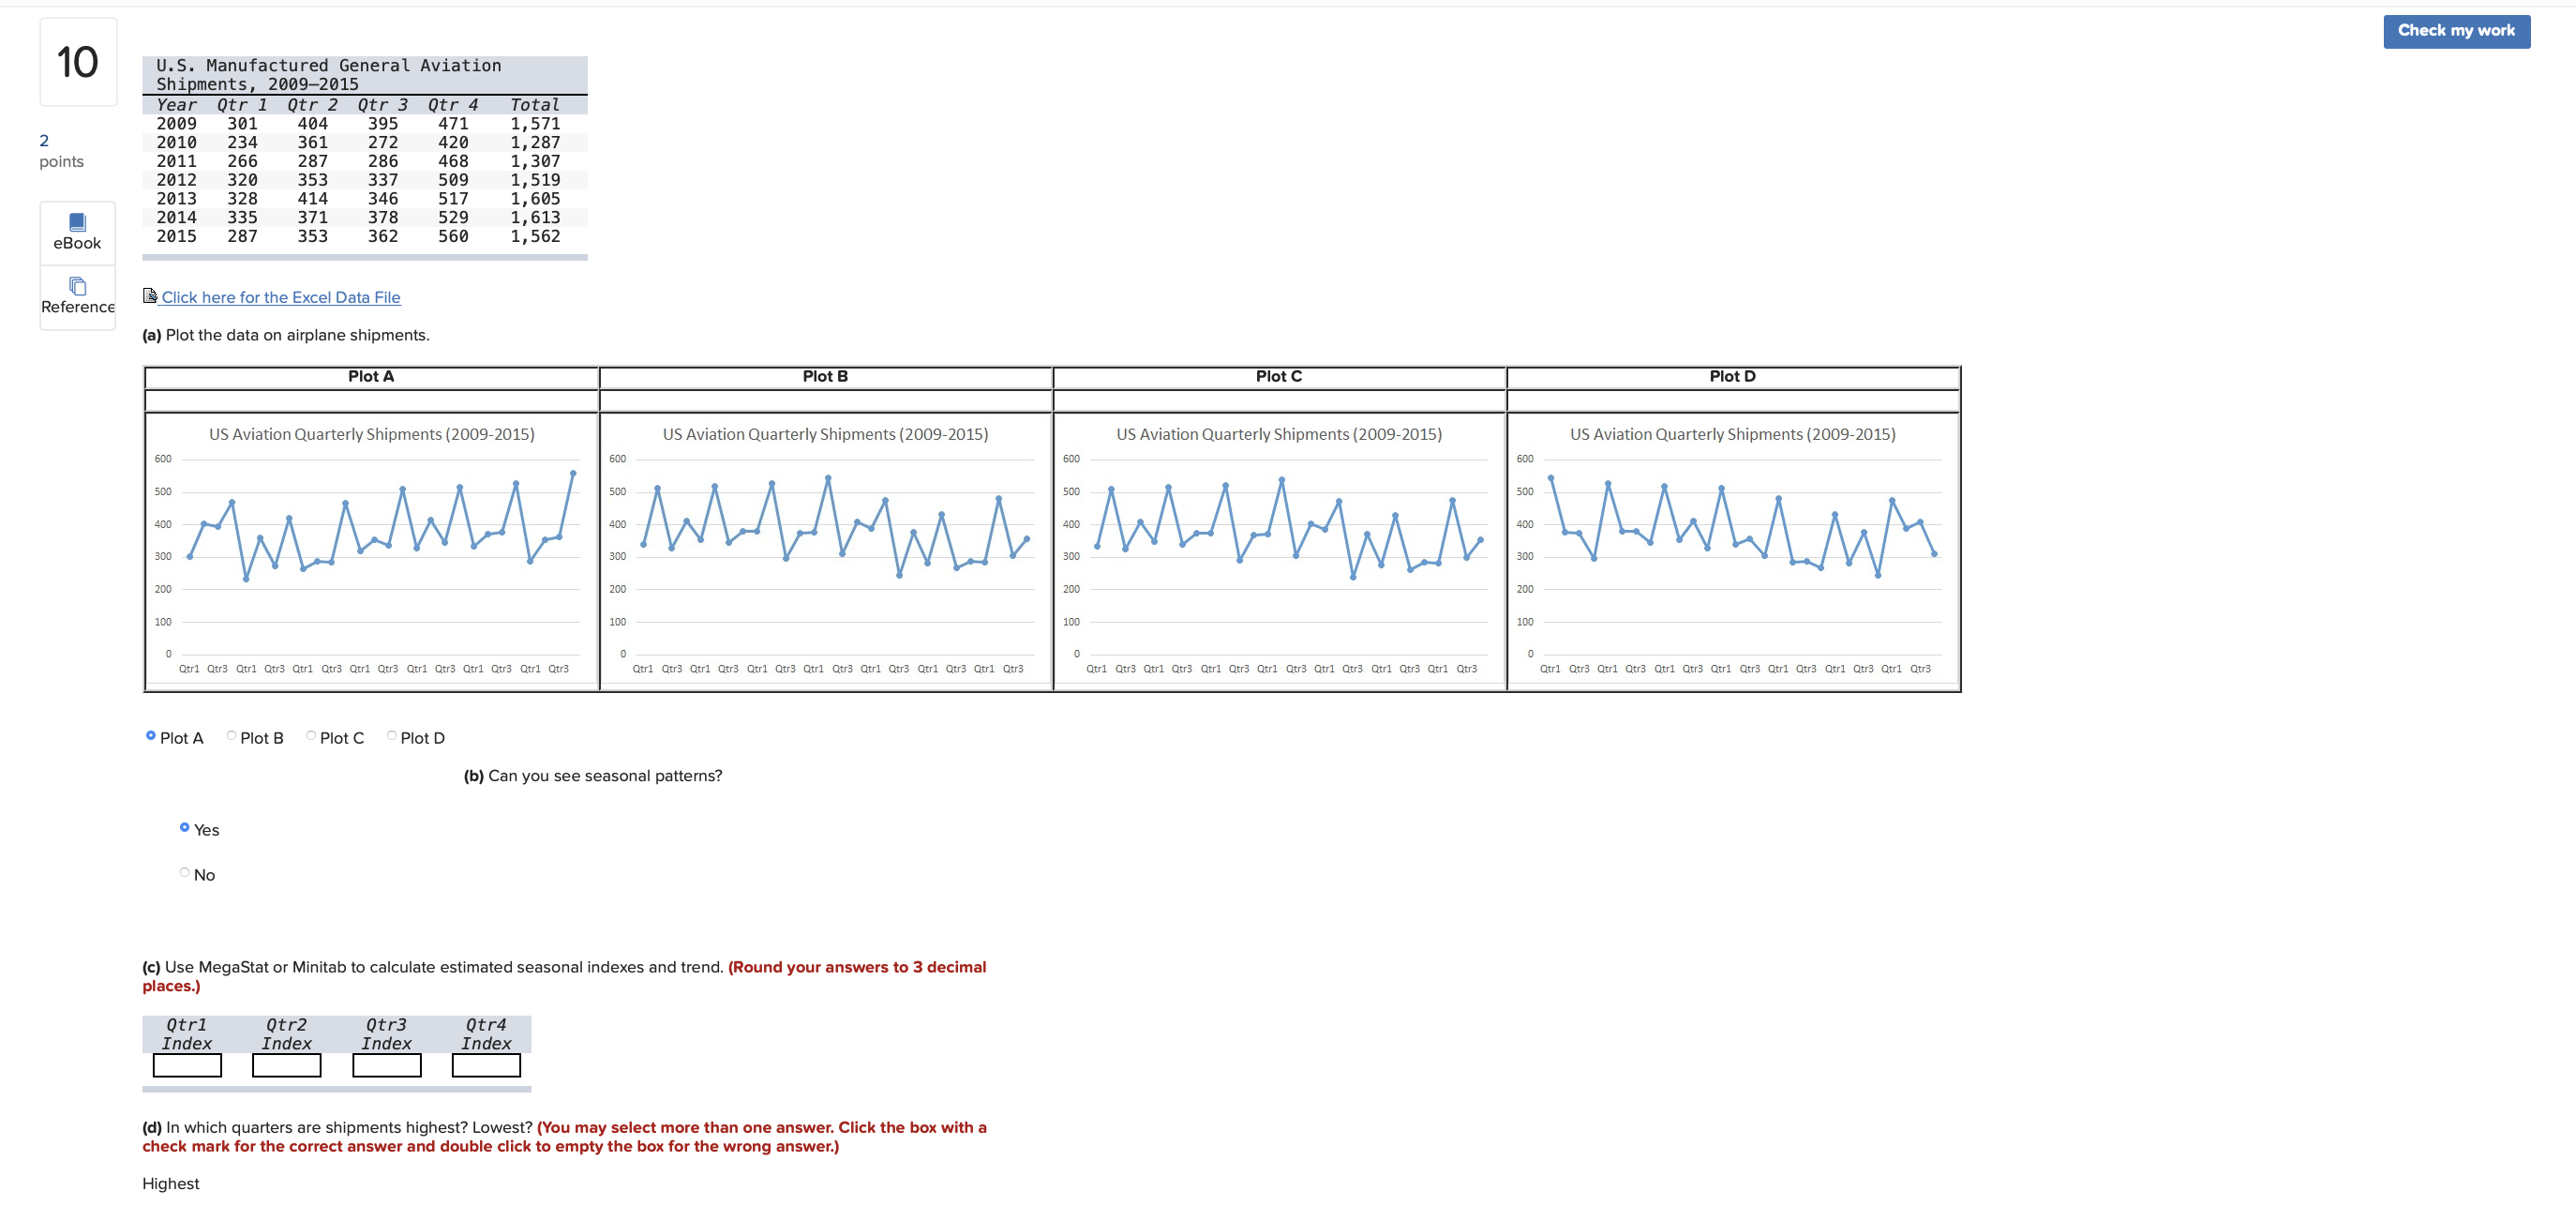
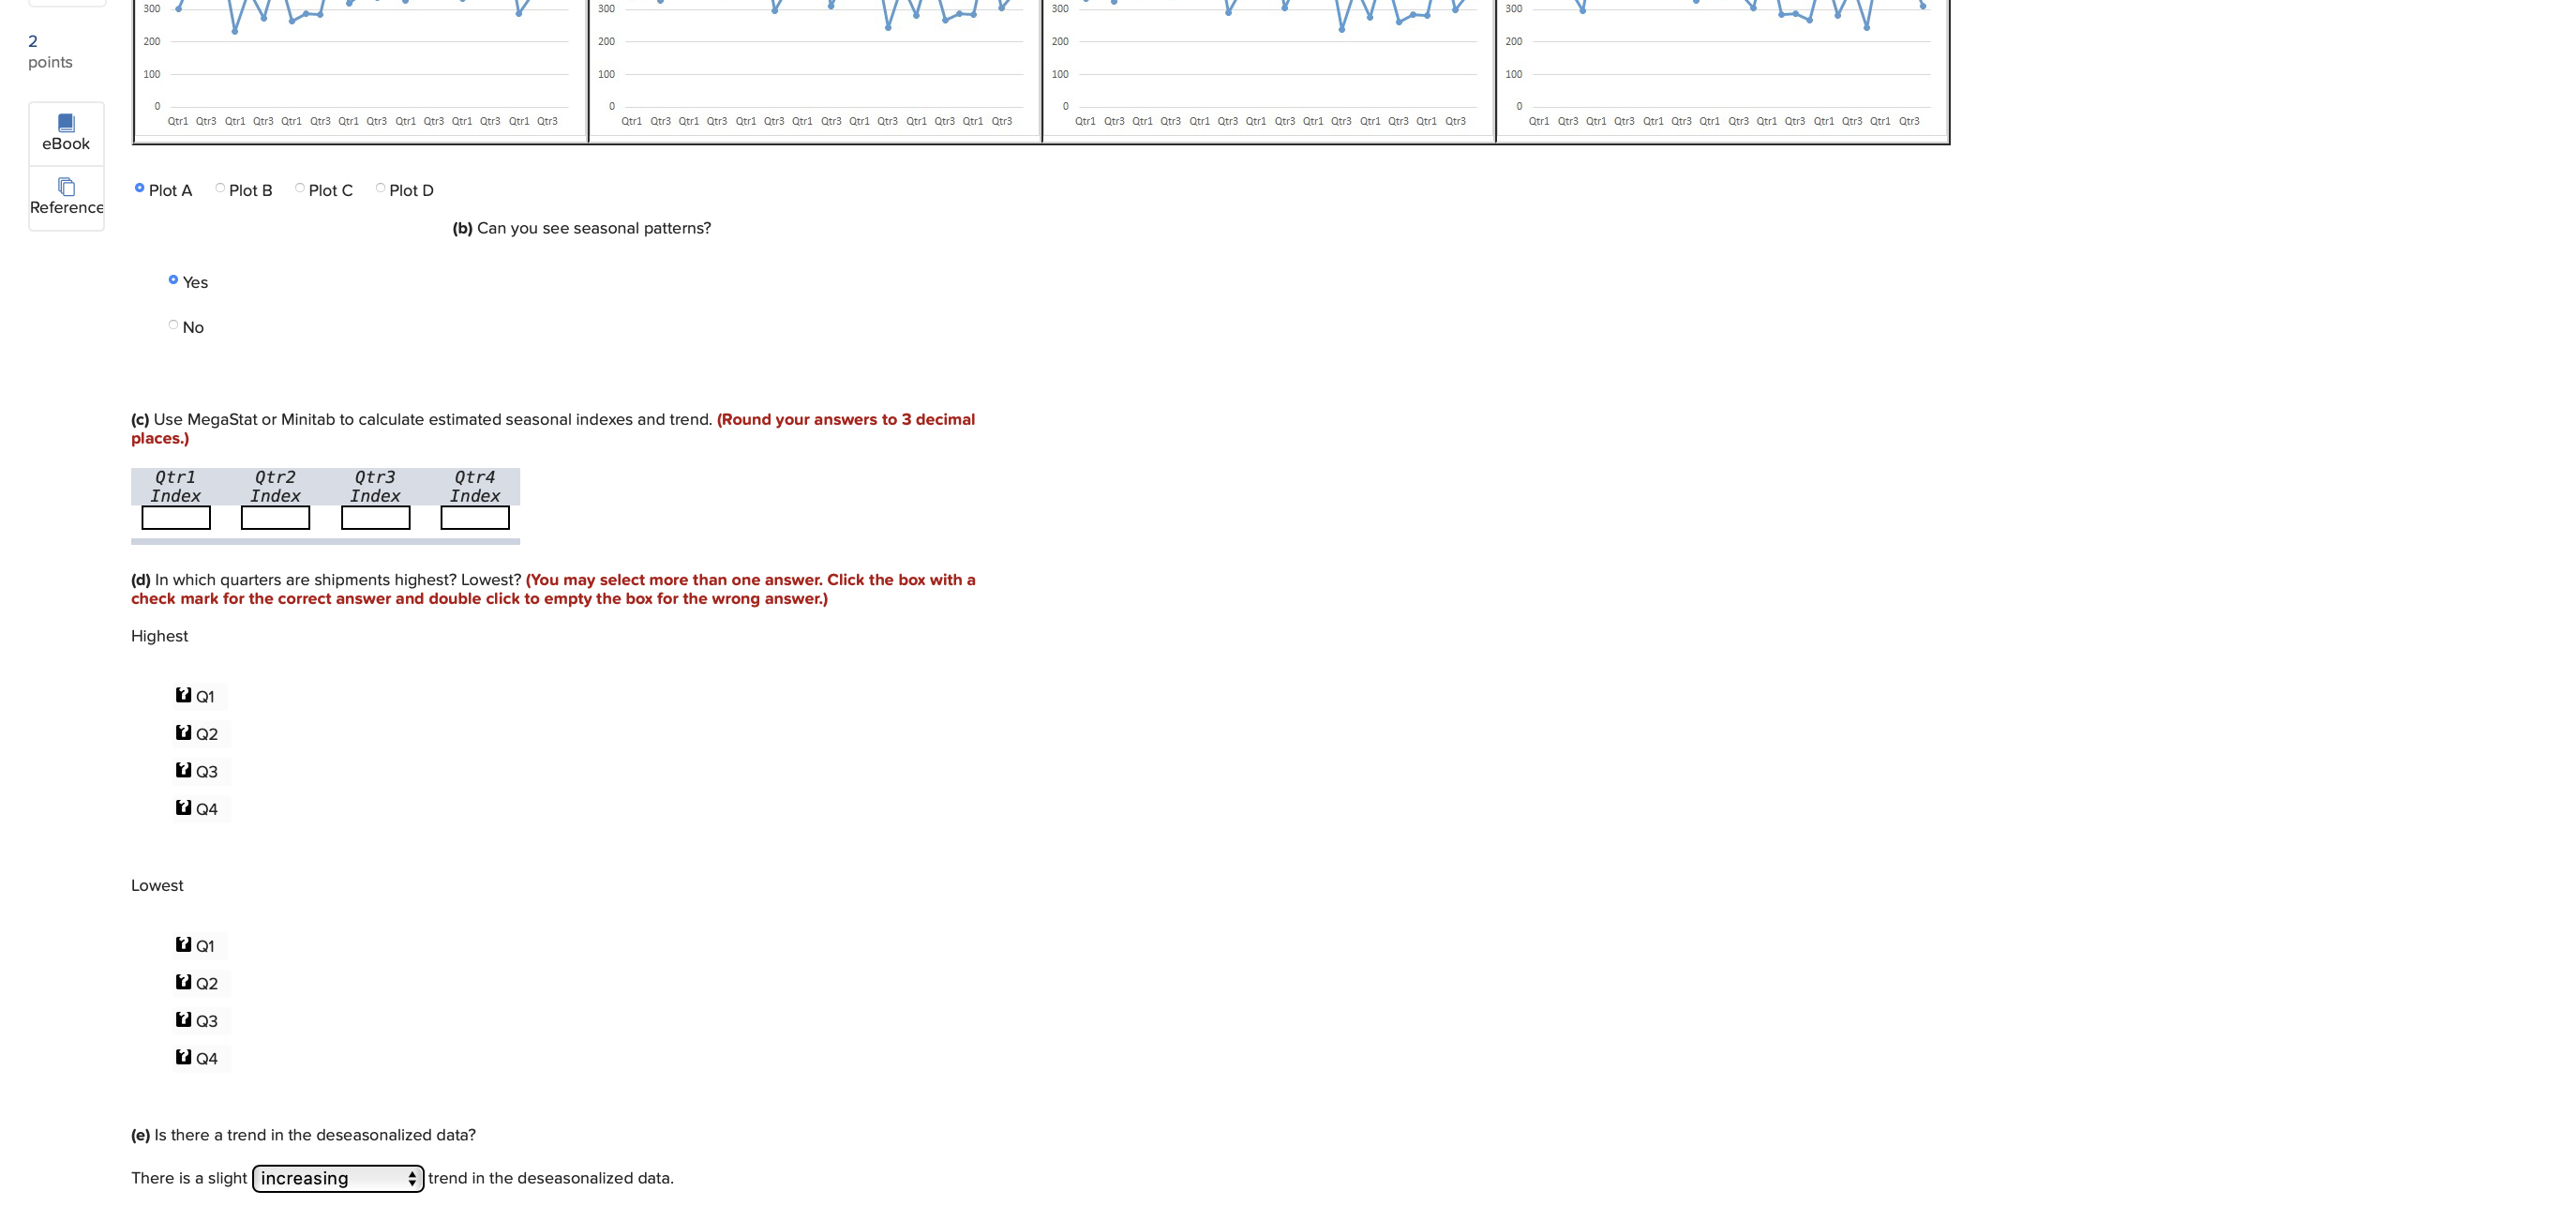
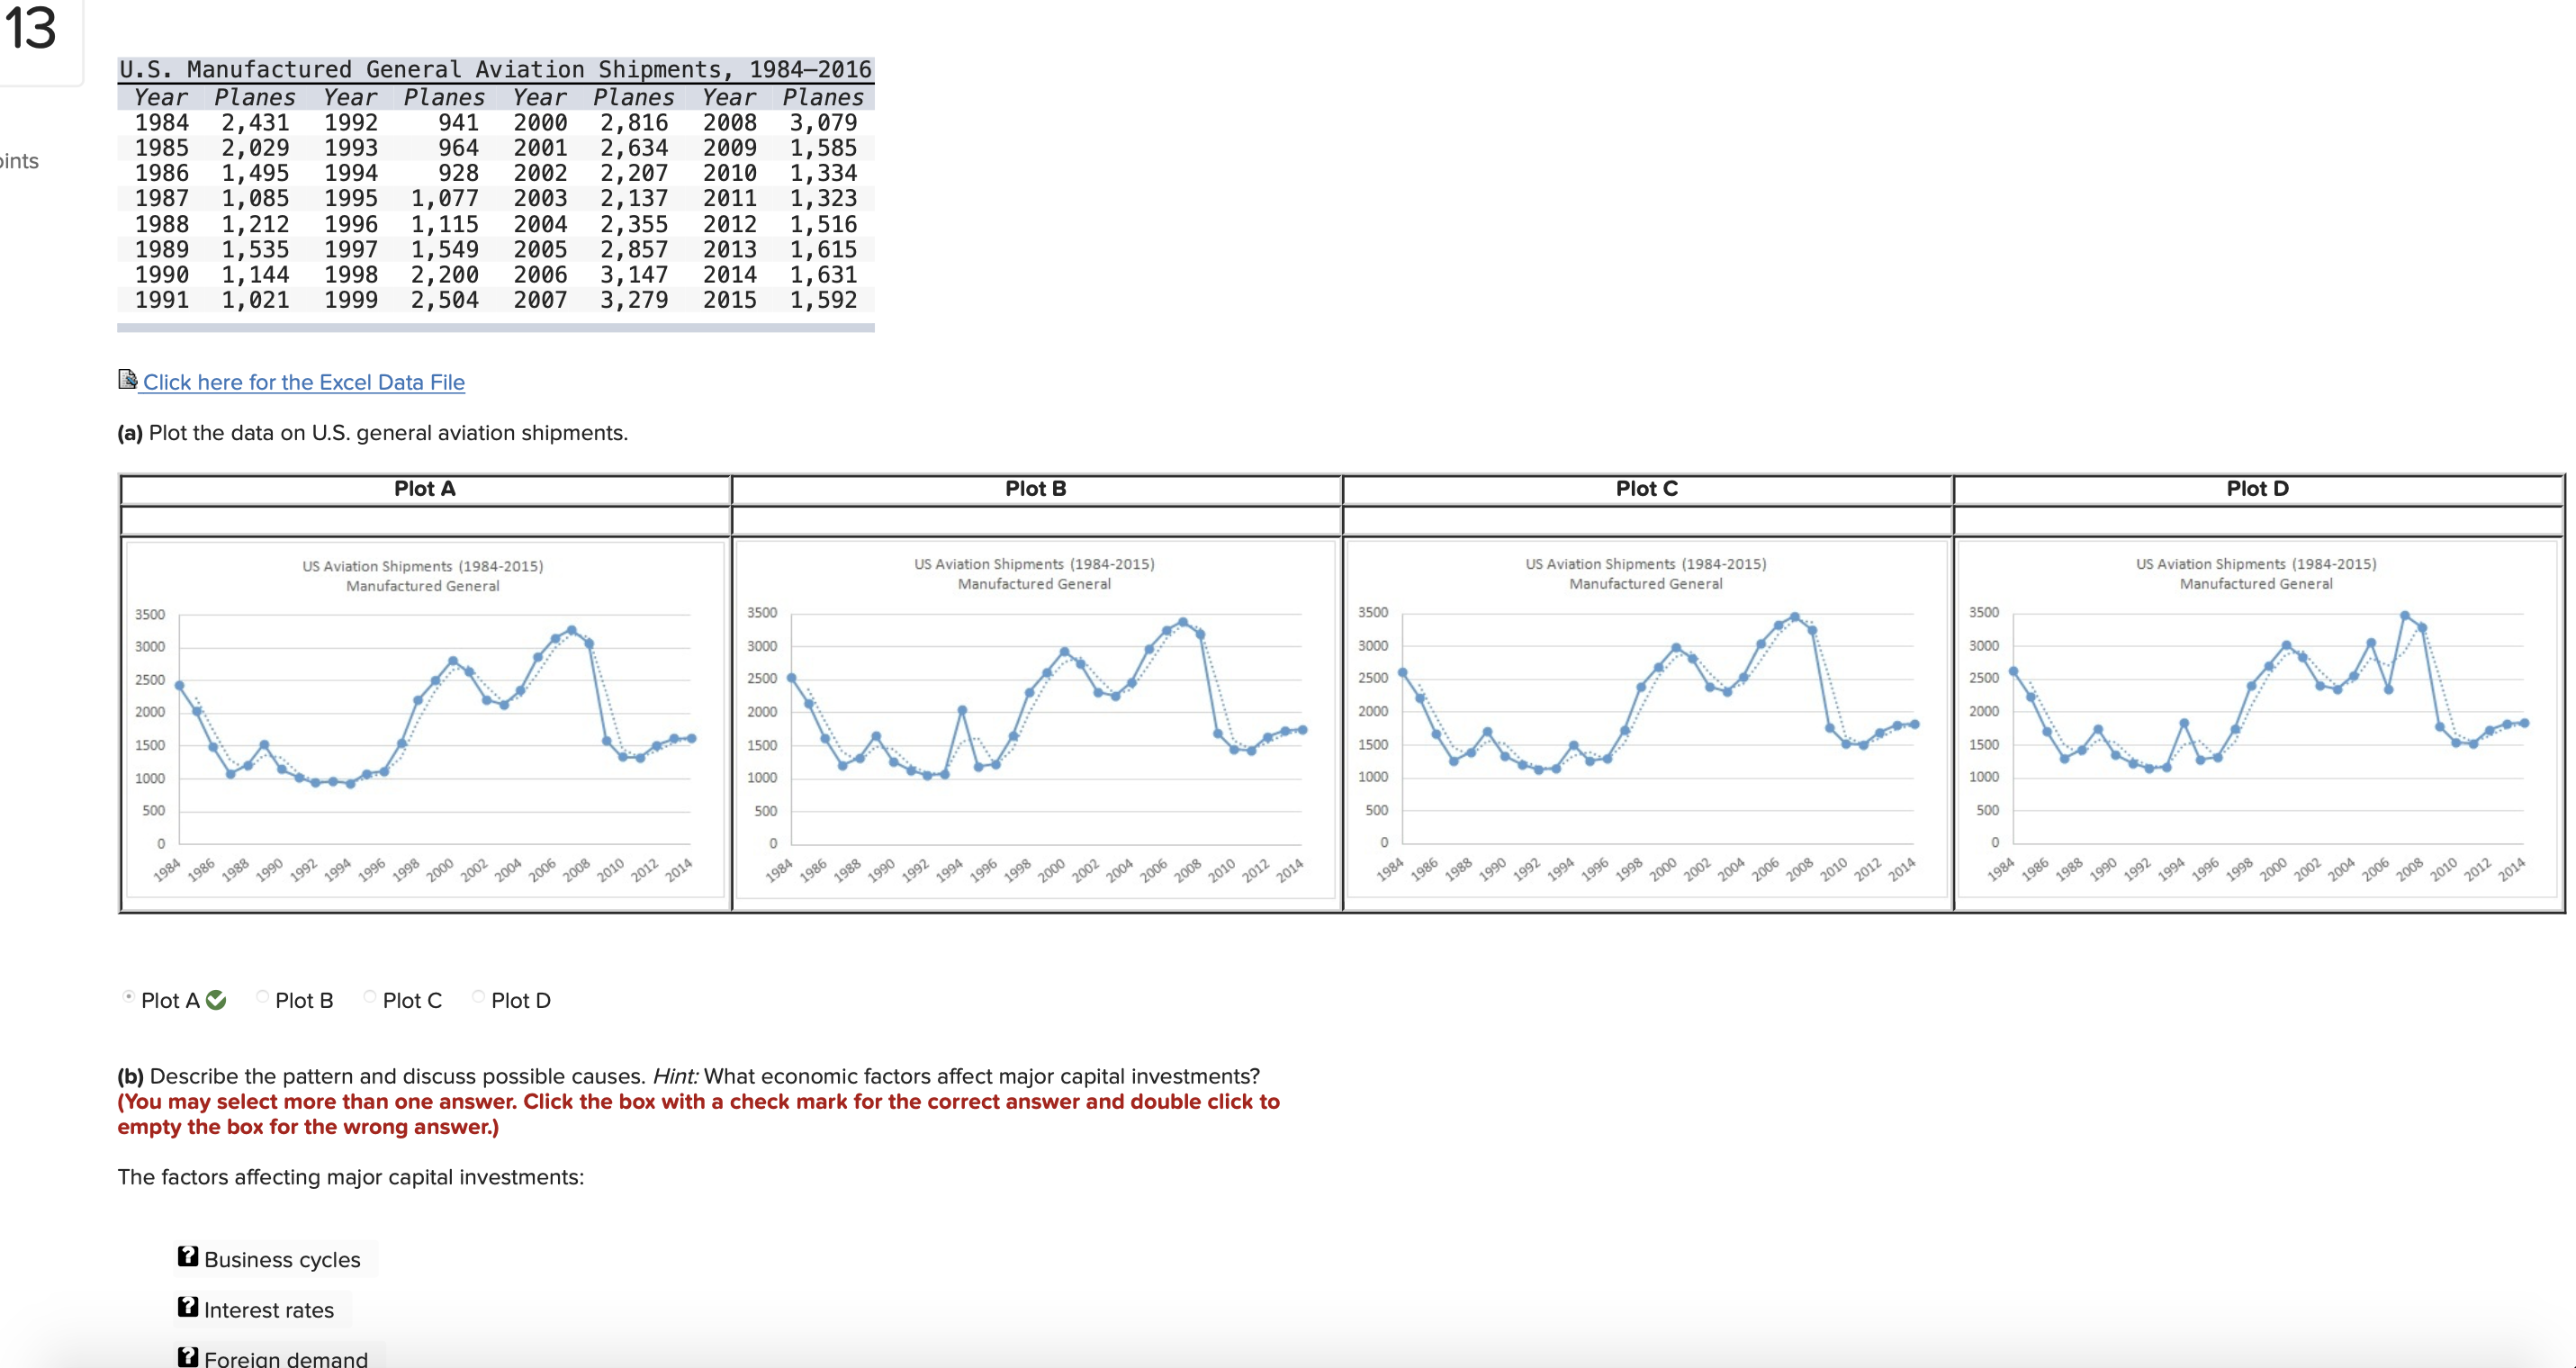
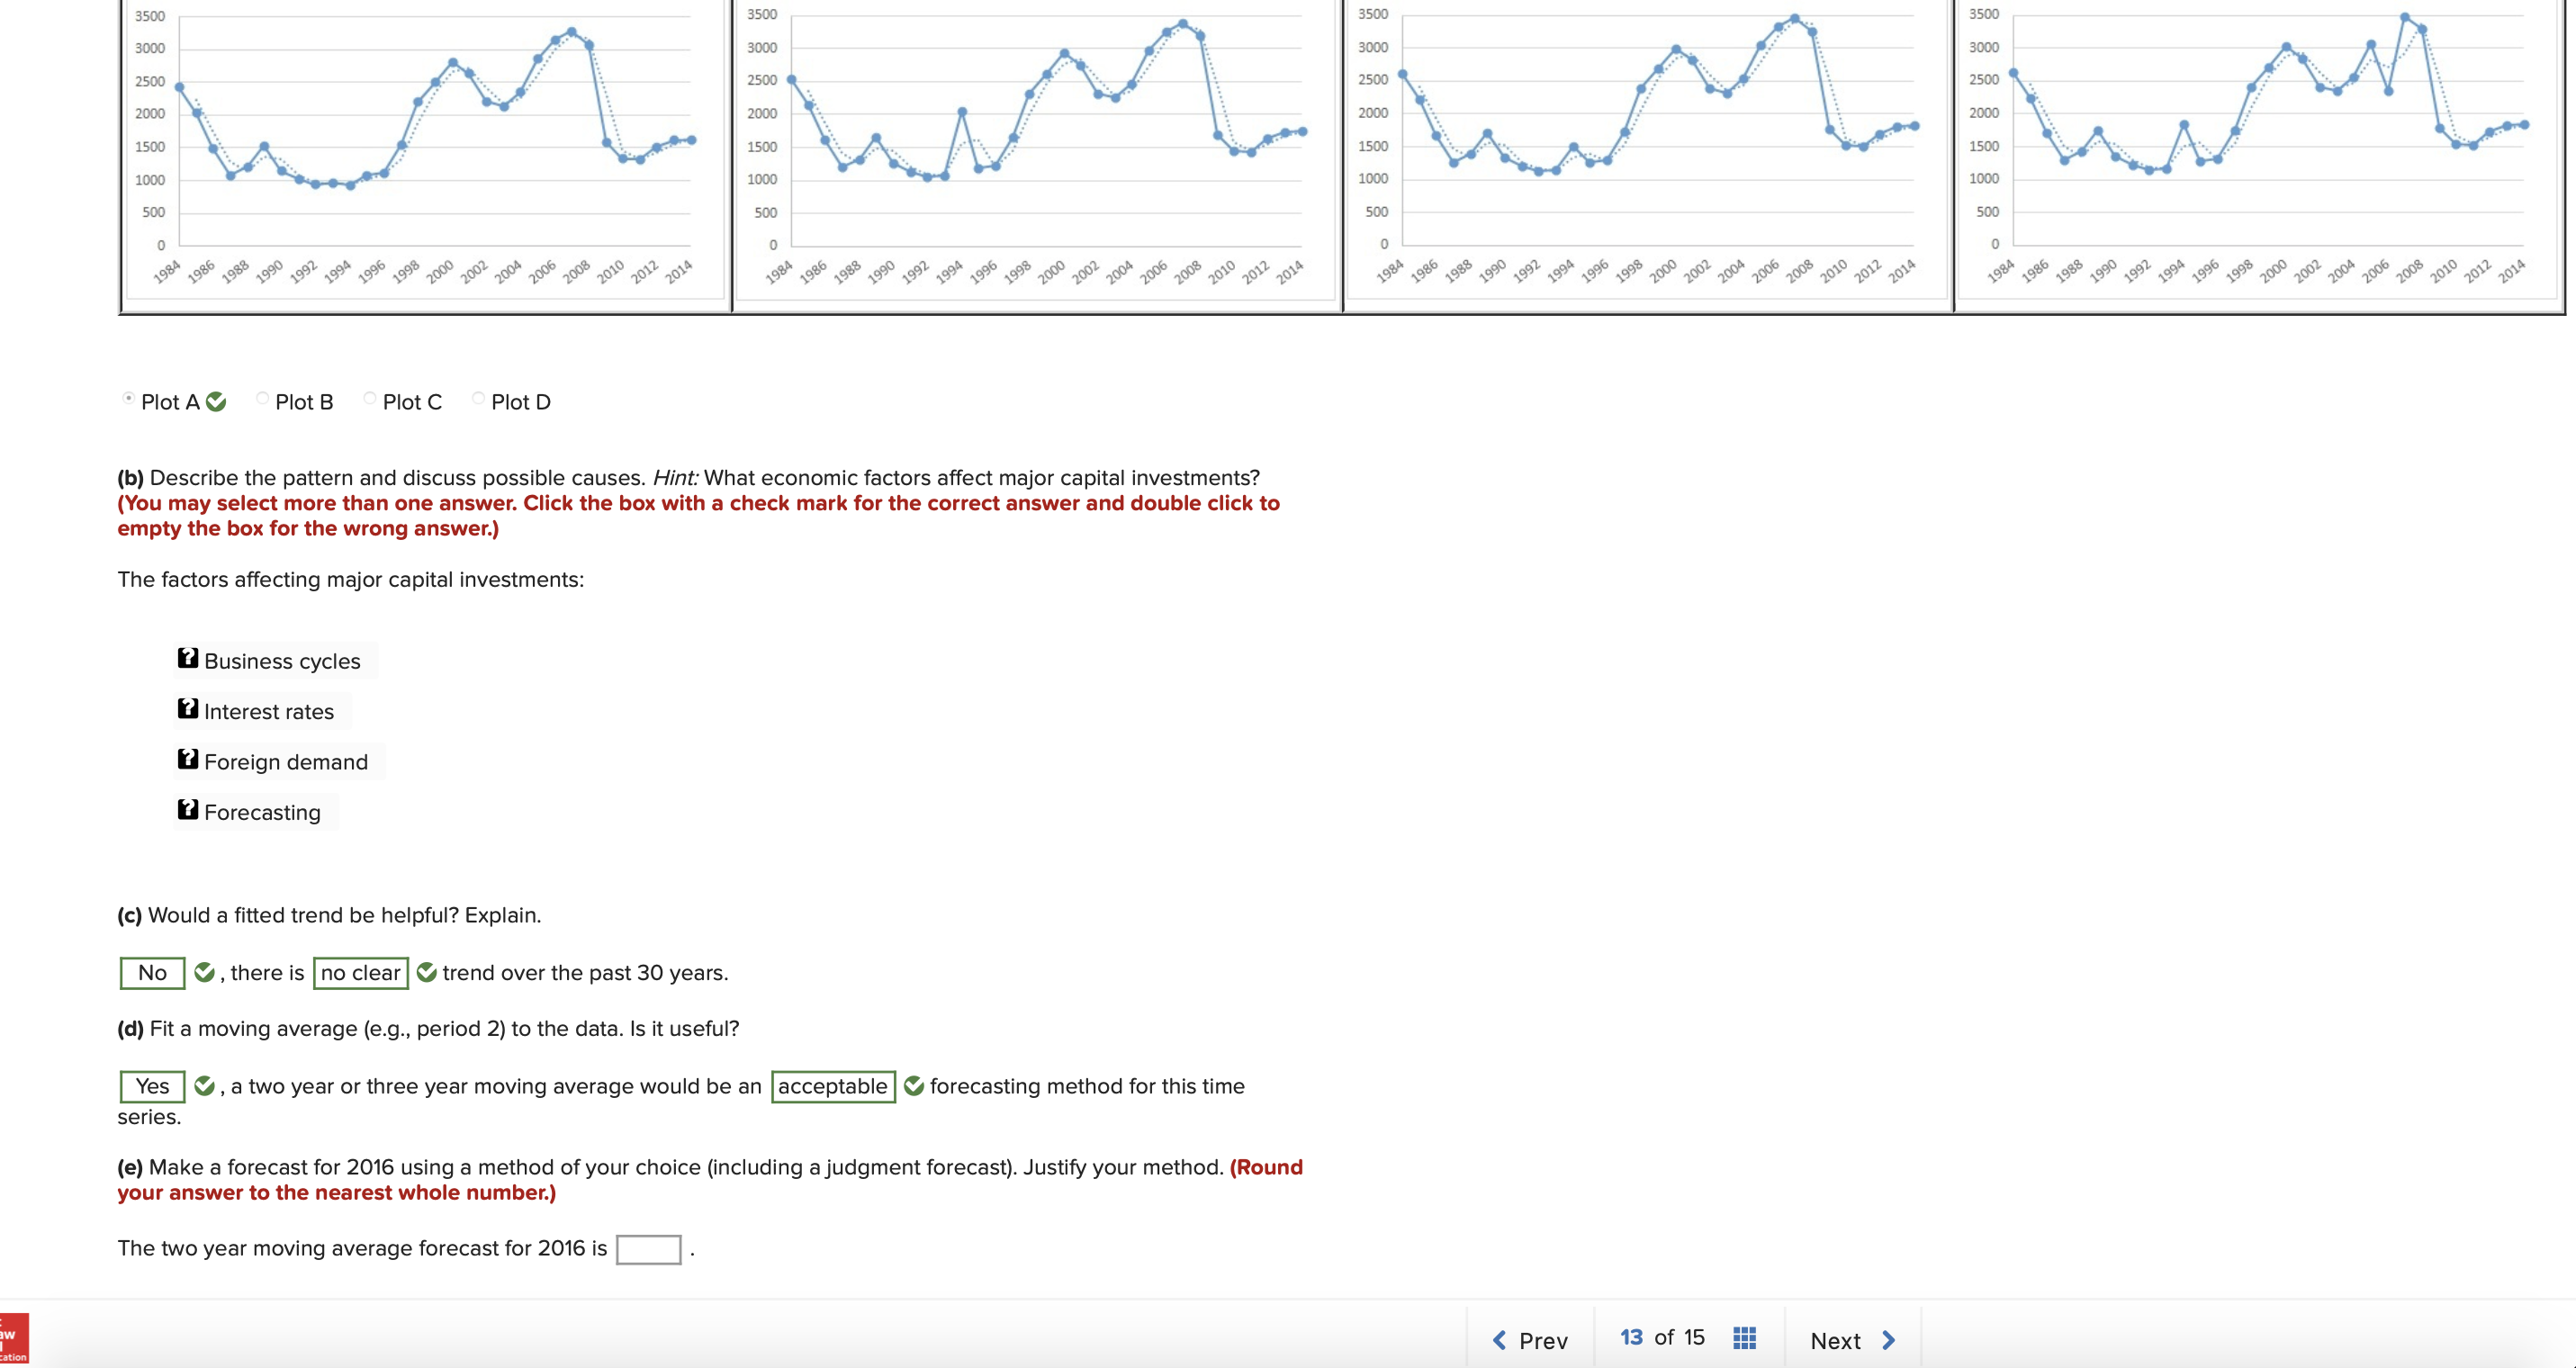
Check my work 10 U. S. Manufactured General Aviation Shipments, 2009-2015 Year Qtr 2 Qtr 3 Qtr 4 Total 2009 Qtr 1 301 404 395 471 1, 571 2 2010 234 361 272 420 1, 287 points 2011 266 287 286 468 1, 307 2012 320 353 337 509 1, 519 2013 328 414 346 517 1, 605 2014 335 287 371 378 529 1, 613 eBook 2015 353 362 560 1, 562 Reference Click here for the Excel Data File (a) Plot the data on airplane shipments. Plot A Plot B Plot C Plot D US Aviation Quarterly Shipments (2009-2015) US Aviation Quarterly Shipments (2009-2015) US Aviation Quarterly Shipments (2009-2015) US Aviation Quarterly Shipments (2009-2015) 600 600 600 600 500 50 0 500 400 400 300 300 300 200 200 200 200 100 100 100 100 Qtri Qtr3 Qtri Qtr3 Qtri Qtr3 Qtri Qtr3 Qtri Qtr3 Qtri Qtr3 Qtri Qtr3 Qtri Qtr3 Qtri Qtr3 Qtri Qtr3 Qtri Qtr3 Qtri Qtr3 Qtri Qtr3 Qtri Qtr3 Qtri Qtr3 Qtri Qtr3 Qtri Qtr3 Qtri Qtr3 Qtri Qtr3 Qtri Qtr3 Qtri Qtr3 Qtri Qtr3 Qtri Qtr3 Qtri Qtr3 Qtri Qtr3 Qtri Qtr3 Qtri Qtr3 Qtri Qtr3 Plot A Plot B Plot C Plot D (b) Can you see seasonal patterns? Yes No places.) (c) Use MegaStat or Minitab to calculate estimated seasonal indexes and trend. (Round your answers to 3 decimal Qtri Qtr2 Qtr3 Qtr4 Index Index Index Index (d) In which quarters are shipments highest? Lowest? (You may select more than one answer. Click the box with a check mark for the correct answer and double click to empty the box for the wrong answer.) Highest300 300 300 2 200 200 200 200 points 100 100 100 100 0 Qtri Qtr3 Qtri Qtr3 Qtri Qtr3 Qtri Qtr3 Qtri Qtr3 Qtri Qtr3 Qtri Qtr3 Qtri Qtr3 Qtri Qtr3 Qtri Qtr3 Qtri Qtr3 Qtri Qtr3 Qtri Qtr3 Qtri Qtr3 Qtri Qtr3 Qtri Qtr3 Qtri Qtr3 Qtri Qtr3 Qtri Qtr3 Qtri Qtr3 Qtri Qtr3 Qtri Qtr3 Qtri Qtr3 Qtri Qtr3 Qtri Qtr3 Qtri Qtr3 Qtri Qtr3 Qtri Qtr3 eBook Plot A Plot B Plot C Plot D Reference (b) Can you see seasonal patterns? Yes No (c) Use MegaStat or Minitab to calculate estimated seasonal indexes and trend. (Round your answers to 3 decimal places.) Qtr1 Qtr2 Qtr3 Qtr4 Index Index Index Index (d) In which quarters are shipments highest? Lowest? (You may select more than one answer. Click the box with a check mark for the correct answer and double click to empty the box for the wrong answer.) Highest 2 Q1 7 Q2 7 Q3 2 Q4 Lowest 2 Q1 2 Q2 7 Q3 Q4 (e) Is there a trend in the deseasonalized data? There is a slight increasing trend in the deseasonalized data.13 U. S. Manufactured General Aviation Shipments, 1984-2016 Year Planes 1984 2, 431 Year Planes 1992 Year Planes 941 Year Planes ints 1985 1986 2, 029 2000 2, 816 2008 3, 079 1, 495 1993 1994 964 2001 1987 1, 085 928 2, 634 2002 1995 1, 077 2, 207 2009 1, 585 2010 1, 212 1996 2003 1, 334 1988 1989 1, 535 1997 1, 115 2004 2, 137 2, 355 2011 1, 323 2012 1, 516 1990 1, 144 1998 1, 549 2, 200 2005 2, 857 2013 1, 615 1991 1, 021 1999 2, 504 2006 2007 3, 147 3, 279 2014 2015 1, 631 1, 592 Click here for the Excel Data File (a) Plot the data on U.S. general aviation shipments. Plot A Plot B Plot C Plot D US Aviation Shipments (1984-2015) Manufactured General US Aviation Shipments (1984-2015) Manufactured General US Aviation Shipments (1984-2015) 3500 Manufactured General US Aviation Shipments (1984-2015) 3500 3000 3500 Manufactured General 3500 3000 2500 3000 3000 2500 2500 2000 2500 2000 1500 2000 2000 1500 1000 1500 1000 1500 1000 500 500 1000 500 0 500 0 1984 1986 1988 1990 1992 1994 1996 1998 2000 2002 2004 2006 2008 2010 2012 2014 1984 1986 1988 1990 1992 1994 0 1996 1998 2000 2002 2004 2006 2008 2010 2012 2014 1984 1986 1988 1990 1992 1994 1996 1998 2000 2002 2004 2006 2008 2010 2012 2014 1984 1986 1988 1990 1992 1994 1996 1998 2000 2002 2004 2006 2008 2010 2012 2014 Plot A Plot B Plot C Plot D (b) Describe the pattern and discuss possible causes. Hint: What economic factors affect major capital investments? (You may select more than one answer. Click the box with a check mark for the correct answer and double click to empty the box for the wrong answer.) The factors affecting major capital investments: Business cycles ? Interest rates ? For3500 3000 2500 2000 1500 1000 3500 500 3000 0 2500 1984 1986 2000 1988 1990 1992 1500 1994 1996 1998 2000 1000 3500 2002 2004 2006 500 3000 2008 Plot A 2010 2012 2014 0 2500 1984 2000 Plot B Plot C Plot D 1986 1988 1990 1992 1994 1500 1996 1998 2000 1000 3500 2002 2004 2006 500 3000 2008 empty the box for the wrong answer.) 2010 2012 2500 2014 1984 2000 (b) Describe the pattern and discuss possible causes. Hint: What economic factors affect major capital investments? 1986 1988 The factors affecting major capital investments: 1990 (You may select more than one answer. Click the box with a check mark for the correct answer and double click to 1992 1994 1500 1996 1998 2000 1000 Business cycles 2002 2004 2006 500 2008 2010 ? Interest rates 2012 2014 0 1984 1986 Foreign demand 1986 1990 1992 1994 1996 1998 Forecasting 2000 2002 2004 2006 2008 2010 2012 2014 (c) Would a fitted trend be helpful? Explain. No , there is no clear @ trend over the past 30 years. series. (d) Fit a moving average (e.g., period 2) to the data. Is it useful? Yes , a two year or three year moving average would be an acceptable forecasting method for this time your answer to the nearest whole number.) The two year moving average forecast for 2016 is (e) Make a forecast for 2016 using a method of your choice (including a judgment forecast). Justify your method. (Round