please assist with question #7. including 7C because im not really sure about it.
here is the link to the spreadsheet: https://docs.google.com/spreadsheets/d/11SKcwiD544H96Z83QcXcXCHh74K94Rfz_6z0aEQ3U6A/edit?usp=sharing
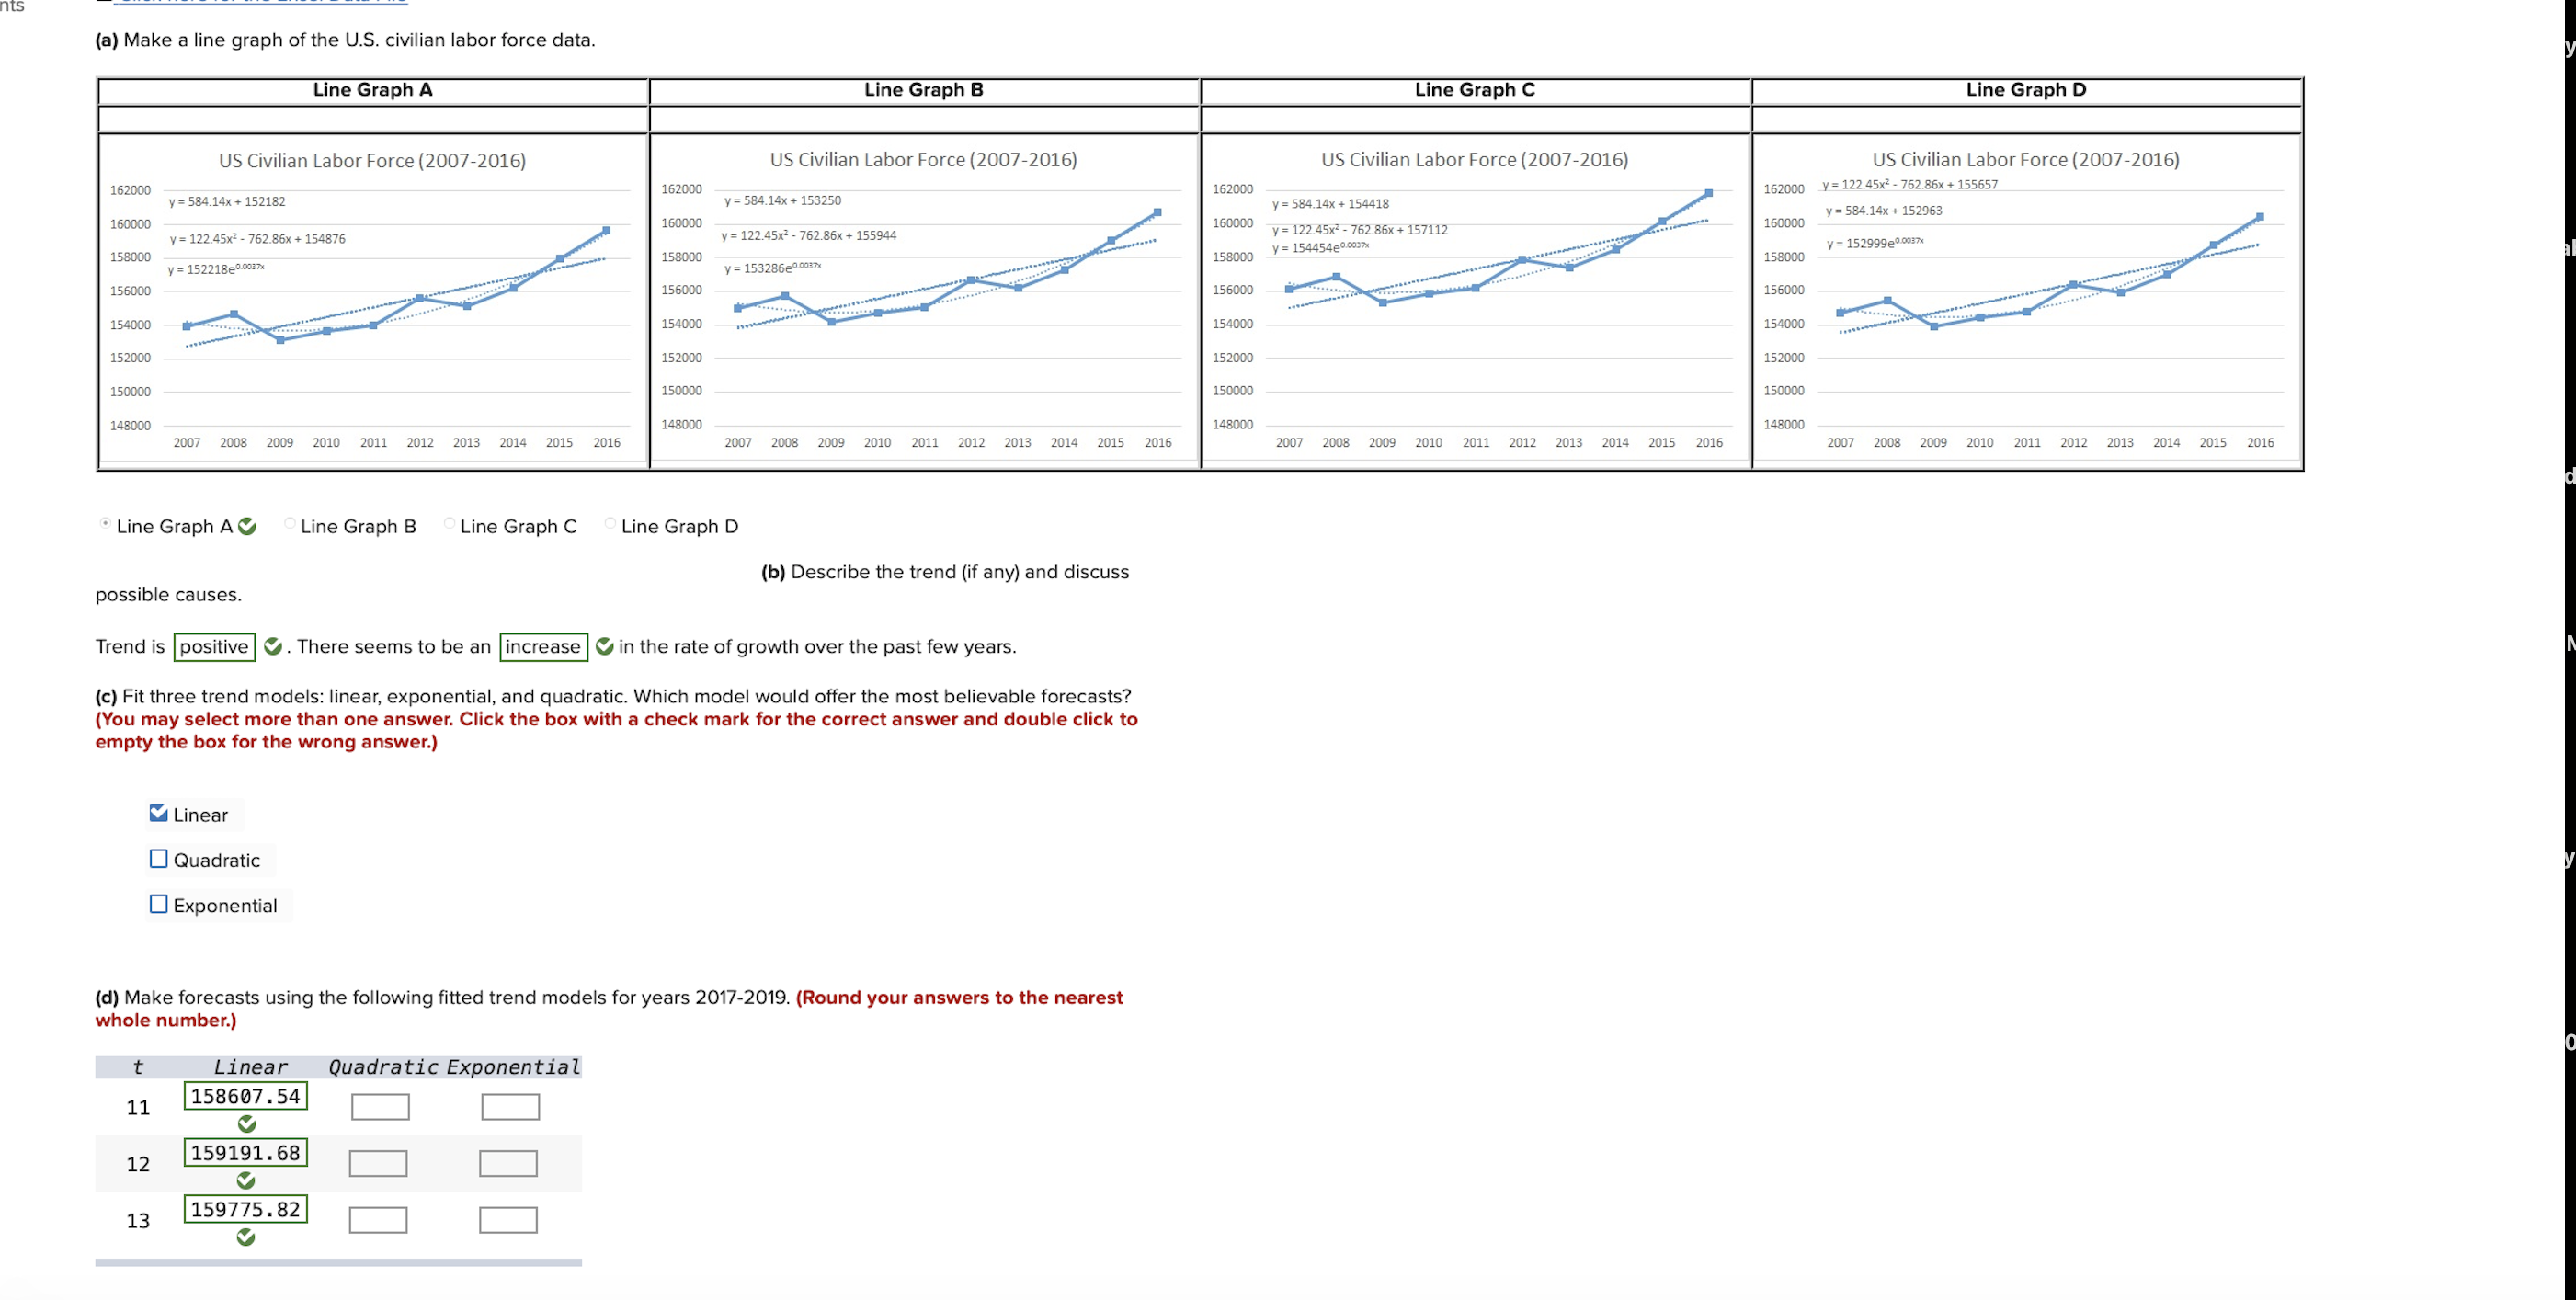
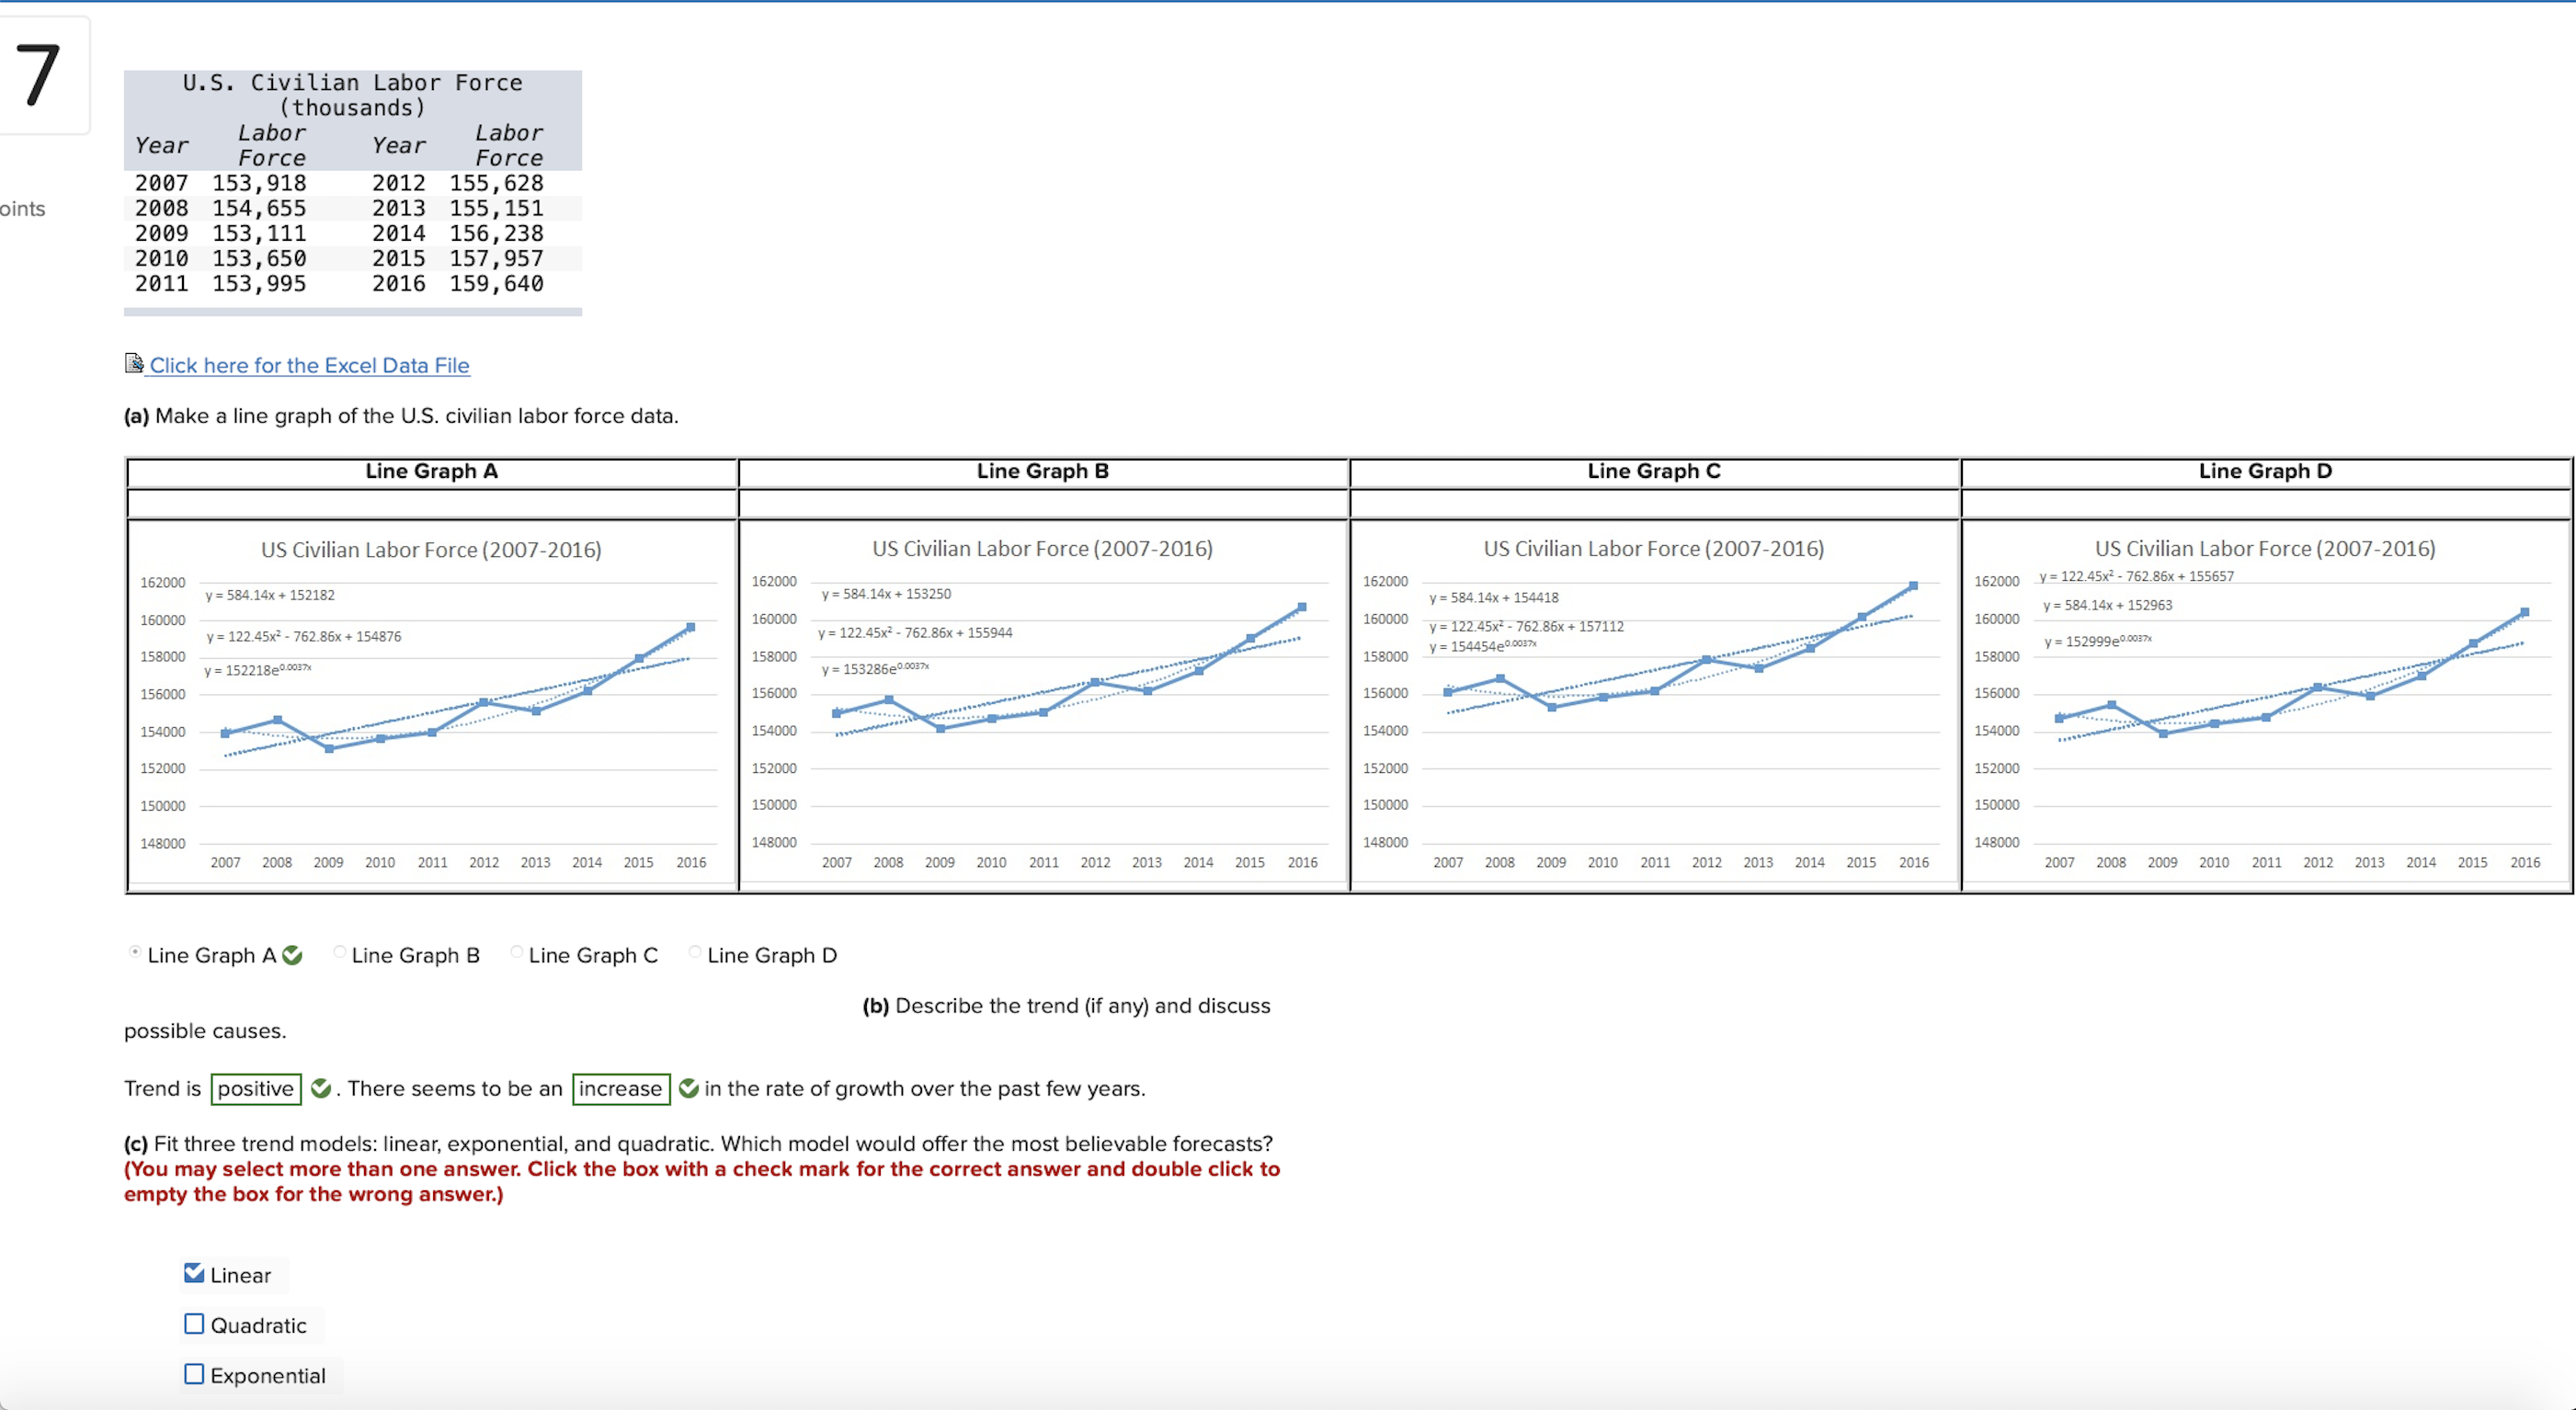
(a) Make a line graph of the U.S. civilian labor force data. Line Graph A Line Graph B Line Graph C Line Graph D US Civilian Labor Force (2007-2016) US Civilian Labor Force (2007-2016) US Civilian Labor Force (2007-2016) US Civilian Labor Force (2007-2016) 162000 y = 584.14x + 152182 162000 y = 584.14x + 153250 16200 y = 584.14x + 154418 162000 y = 122.45x2 - 762.86x + 155657 160000 y = 122.45x2 - 762.86x + 154876 16000 y= 122.45x2 - 762.86x + 155944 160000 y = 122.45x2 - 762.86x + 157112 160000 y = 584.14x + 152963 158000 158000 y = 1544540.0037x y = 153286 0.0037x 158000 158000 y = 1529990.0037x y = 1522180.0037x 156000 156000 156000 156000 154000 154000 154000 154000 152000 152000 152000 152000 150000 150000 150000 150000 148000 148000 148000 2007 2008 2009 2010 2011 2012 2013 2014 2015 2016 148000 2007 2008 2009 2010 2011 2012 2013 2014 2015 2016 2007 2008 2009 2010 2011 2012 2013 2014 2015 2016 2007 2008 2009 2010 2011 2012 2013 2014 2015 2016 Line Graph AC Line Graph B Line Graph C Line Graph D (b) Describe the trend (if any) and discuss possible causes. Trend is positive . There seems to be an increase @ in the rate of growth over the past few years. (c) Fit three trend models: linear, exponential, and quadratic. Which model would offer the most believable forecasts? You may select more than one answer. Click the box with a check mark for the correct answer and double click to empty the box for the wrong answer.) Linear O Quadratic Exponential (d) Make forecasts using the following fitted trend models for years 2017-2019. (Round your answers to the nearest whole number.) t Linear Quadratic Exponential 11 158607.54 12 159191. 68 13 159775 . 82U.S. Civilian Labor Force ( thousands) Year Labor Labor Force Year 2007 153, 918 Force 2012 155, 628 oints 2008 154, 655 2013 155, 151 2009 153, 111 2010 153, 650 4 156, 238 2015 157, 957 2011 153, 995 2016 159, 640 Click here for the Excel Data File (a) Make a line graph of the U.S. civilian labor force data. Line Graph A Line Graph B Line Graph C ine Graph D US Civilian Labor Force (2007-2016) US Civilian Labor Force (2007-2016) US Civilian Labor Force (2007-2016) US Civilian Labor Force (2007-2016) 162000 y = 584.14x + 152182 162000 y = 584.14x + 153250 162000 y = 584.14x + 154418 162000 = 122.45x2 - 762.86x + 155657 160000 160000 160000 160000 y = 584.14x + 152963 y = 122.45x2 - 762.86x + 154876 y = 122.45x2 - 762.86x + 155944 y = 122.45x2 - 762.86x + 157112 158000 y = 1522180.0037x 158000 158000 y = 1544540.0037x y = 1529990.0037% y = 1532860 0037x 158000 15600 156000 156000 156000 154000 154000 154000 15400 15200 152000 152000 15200 150000 150000 150000 150000 14800 148000 148000 148000 2007 2008 2009 2010 2011 2012 2013 2014 2015 2016 2007 2008 2009 2010 2011 2012 2013 2014 2015 2016 2007 2008 2009 2010 2011 2012 2013 2014 2015 2016 2007 2008 2009 2010 2011 2012 2013 2014 2015 2016 Line Graph A Line Graph B Line Graph C Line Graph D (b) Describe the trend (if any) and discuss possible causes. Trend is positive . There seems to be an |increase @ in the rate of growth over the past few years. (c) Fit three trend models: linear, exponential, and quadratic. Which model would offer the most believable forecasts? (You may select more than one answer. Click the box with a check mark for the correct answer and double click to empty the box for the wrong answer.) Linear Quadratic Exponential