Please assist with Walking through these problems
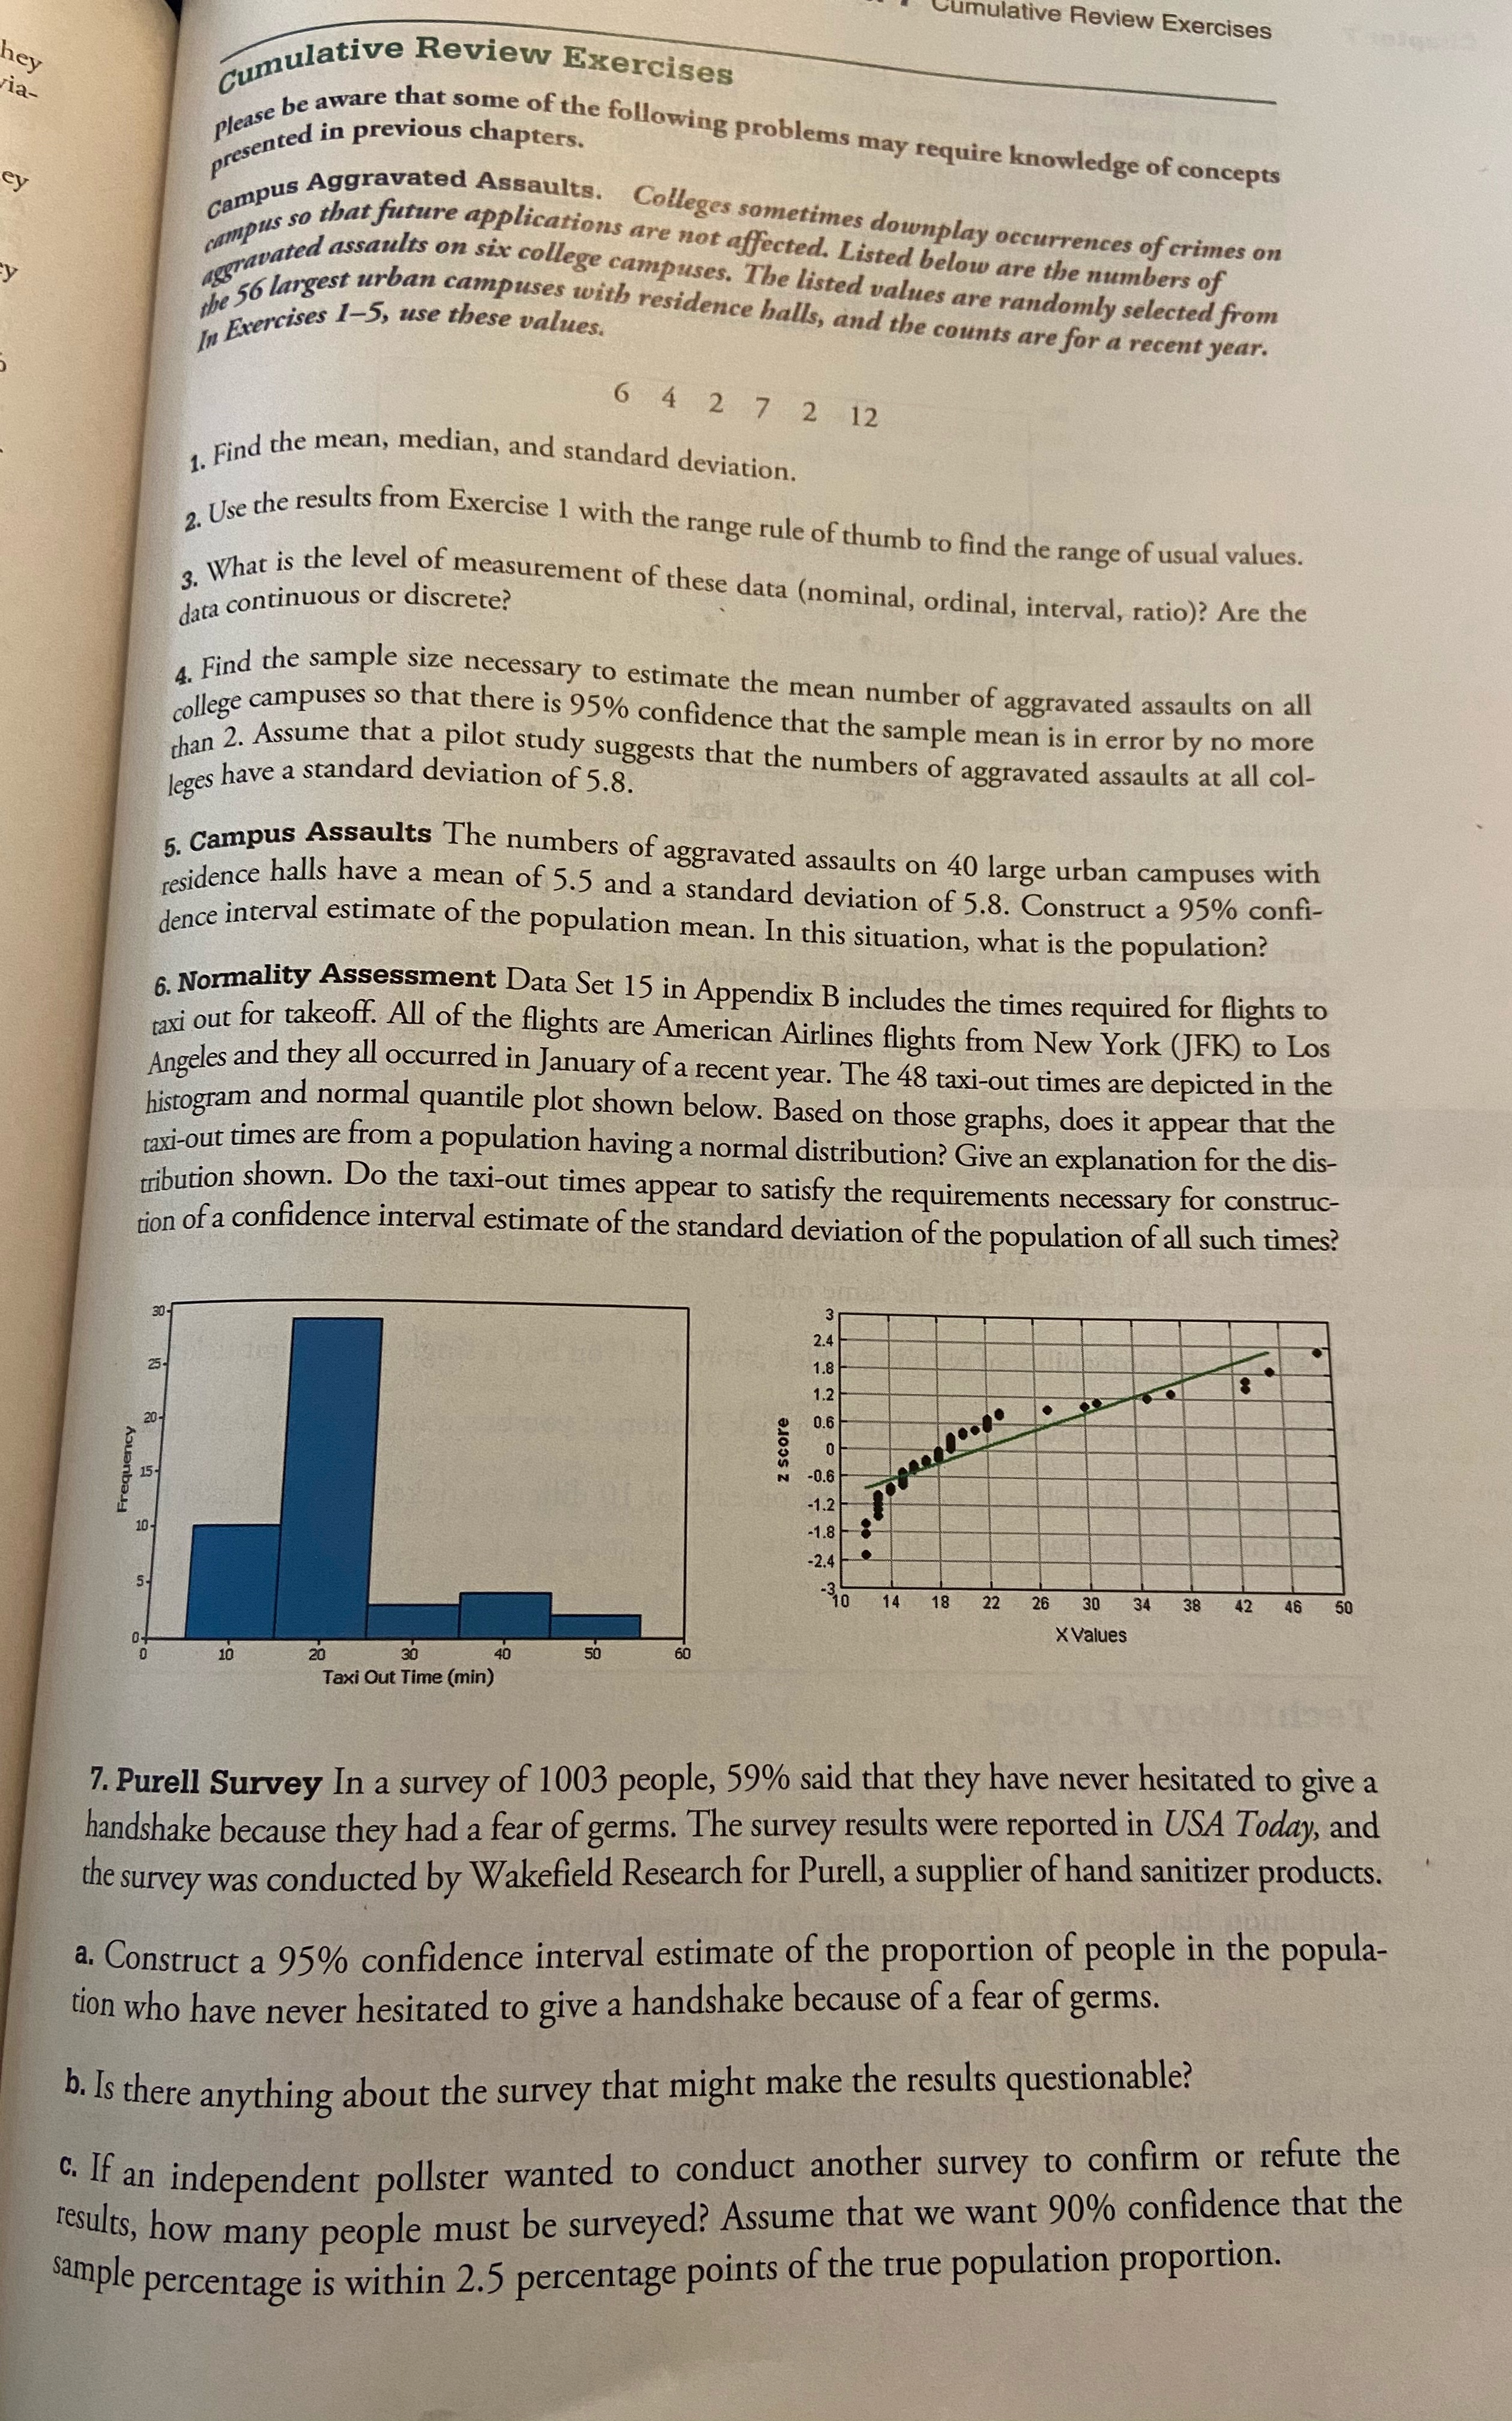
umulative Review Exercises hey ria- Cumulative Review Exercises use be aware that some of the following problems may require knowledge of concepts presented in previous chapters. Campus Aggravated Assaults. Colleges sometimes downplay occurrences of crimes on Campus so that future applications are not affected. Listed below are the numbers of Cravated assaults on six college campuses. The listed values are randomly selected from The 56 largest urban campuses with residence halls, and the counts are for a recent year. In Exercises 1-5, use these values. 6 4 2 7 2 12 1. Find the mean, median, and standard deviation. 2. Use the results from Exercise I with the range rule of thumb to find the range of usual values. 2. What is the level of measurement of these data (nominal, ordinal, interval, ratio)? Are the data continuous or discrete? 4. Find the sample size necessary to estimate the mean number of aggravated assaults on all college campuses so that there is 95% confidence that the sample mean is in error by no more than 2. Assume that a pilot study suggests that the numbers of aggravated assaults at all col- leges have a standard deviation of 5.8. 5. Campus Assaults The numbers of aggravated assaults on 40 large urban campuses with residence halls have a mean of 5.5 and a standard deviation of 5.8. Construct a 95% confi- dence interval estimate of the population mean. In this situation, what is the population: 6. Normality Assessment Data Set 15 in Appendix B includes the times required for flights to taxi out for takeoff. All of the flights are American Airlines flights from New York (JFK) to Los Angeles and they all occurred in January of a recent year. The 48 taxi-out times are depicted in the histogram and normal quantile plot shown below. Based on those graphs, does it appear that the taxi-out times are from a population having a normal distribution? Give an explanation for the dis- tribution shown. Do the taxi-out times appear to satisfy the requirements necessary for construct tion of a confidence interval estimate of the standard deviation of the population of all such times? Frequency 20 z score 0 1.2/ ReBlood. -0.6 -1.8 -2.4 0 en 14 18 22 26 30 34 38 42 46 50 X Values 10 20 30 50 60 Taxi Out Time (min) 7. Purell Survey In a survey of 1003 people, 59% said that they have never hesitated to give a handshake because they had a fear of germs. The survey results were reported in USA Today, and the survey was conducted by Wakefield Research for Purell, a supplier of hand sanitizer products. a. Construct a 95% confidence interval estimate of the proportion of people in the popula- tion who have never hesitated to give a handshake because of a fear of germs. b. Is there anything about the survey that might make the results questionable? C. If an independent pollster wanted to conduct another survey to confirm or refute the results, how many people must be surveyed? Assume that we want 90% confidence that the sample percentage is within 2.5 percentage points of the true population proportion


