Answered step by step
Verified Expert Solution
Question
1 Approved Answer
Please assume that the provided pessimistic and optimistic values in the problem are based on 99 percentile level. Please provide a table or tables


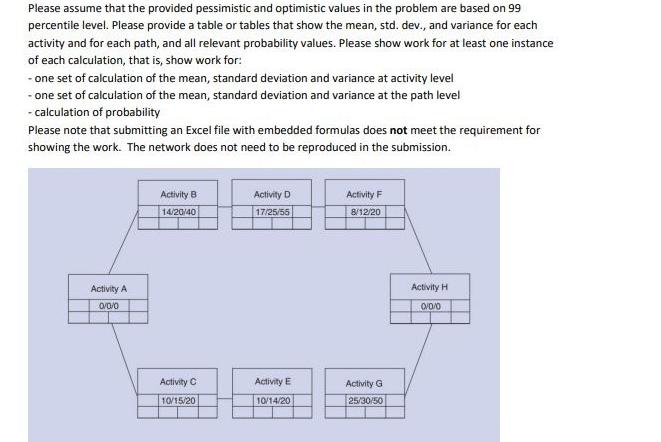
Please assume that the provided pessimistic and optimistic values in the problem are based on 99 percentile level. Please provide a table or tables that show the mean, std. dev., and variance for each activity and for each path, and all relevant probability values. Please show work for at least one instance of each calculation, that is, show work for: - one set of calculation of the mean, standard deviation and variance at activity level - one set of calculation of the mean, standard deviation and variance at the path level - calculation of probability Please note that submitting an Excel file with embedded formulas does not meet the requirement for showing the work. The network does not need to be reproduced in the submission. Activity A 0/0/0 Activity B 14/20/40 Activity C 10/15/20 Activity D 17/25/55 Activity E 10/14/20 Activity F 8/12/20 Activity G 25/30/50 Activity H 0/0/0 What are the probabilities (in percent) of finishing the project in 55 day, 60 days, and 65 days? The requested probabilities should be determined based on the entire network and not just one path.
Step by Step Solution
★★★★★
3.39 Rating (146 Votes )
There are 3 Steps involved in it
Step: 1
To calculate the mean standard deviation and variance for each activity and path we need to know the ...
Get Instant Access to Expert-Tailored Solutions
See step-by-step solutions with expert insights and AI powered tools for academic success
Step: 2

Step: 3

Ace Your Homework with AI
Get the answers you need in no time with our AI-driven, step-by-step assistance
Get Started


