please at the end breifly explain and evaluate the ratios in words thanks

please at the end evaluate the ratio in wording thanks.

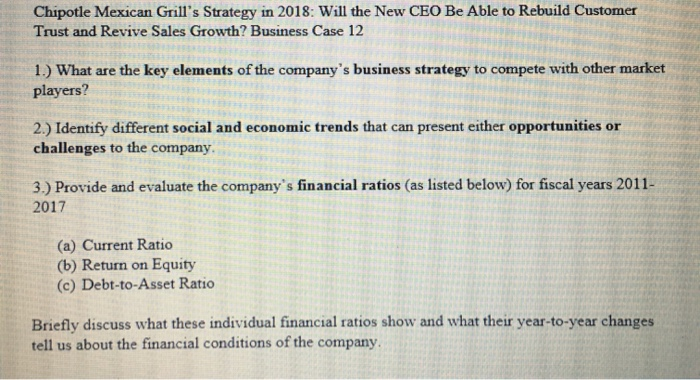
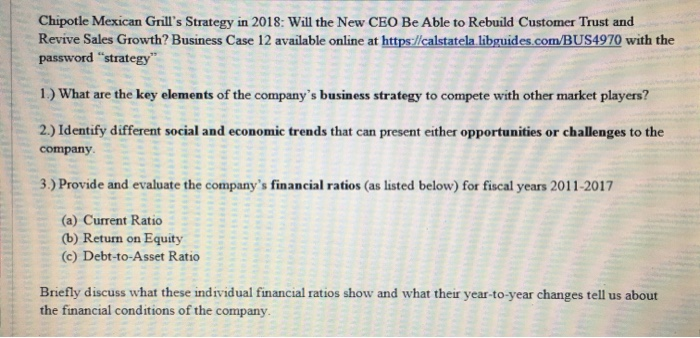
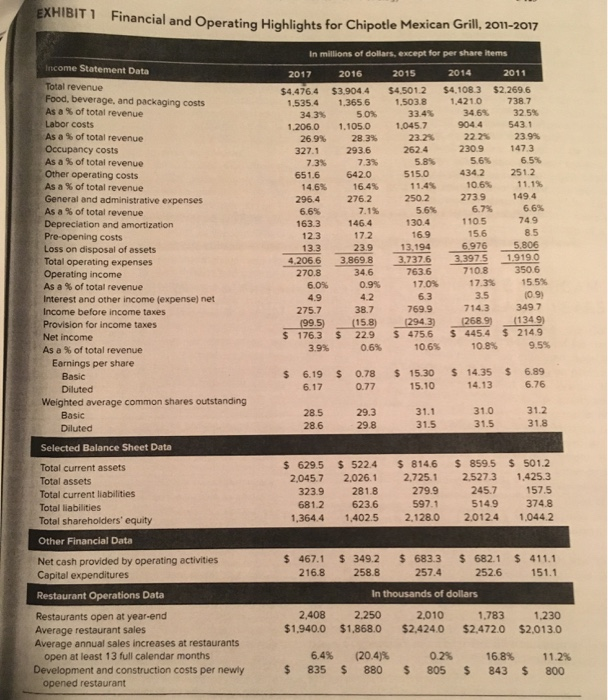
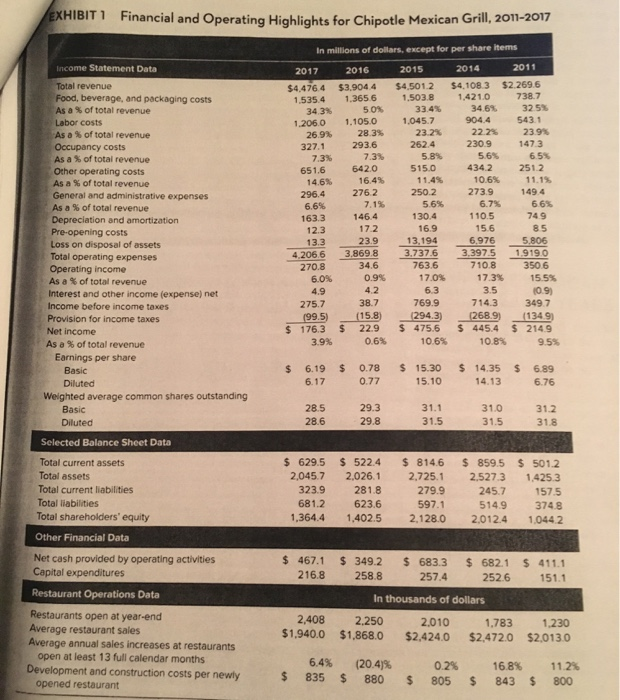
Chipotle Mexican Grill's Strategy in 2018: Will the New CEO Be Able to Rebuild Customer Trust and Revive Sales Growth? Business Case 12 1.) What are the key elements of the company's business strategy to compete with other market players 2.) Identify different social and economic trends that can present either opportunities or challenges to the company 3.) Provide and evaluate the company's financial ratios (as listed below) for fiscal years 2011- 2017 (a) Current Ratio (b) Return on Equity (c) Debt-to-Asset Ratio Briefly discuss what these individual financial ratios show and what their year-to-year changes tell us about the financial conditions of the company. SATO Financial and Operating Highlights for Chipotle Mexican Grill, 2011-2017 Income Statement Data Total revenue Food, beverage, and packaging costs As a % of total revenue Labor costs As a % of total revenue Occupancy costs As a % of total revenue Other operating costs As a % of total revenue General and administrative expenses As a Sof total revenue Depreciation and amortization Pre-opening costs Loss on disposal of assets Total operating expenses Operating income As a of total revenue Interest and other income (expense) net Income before income taxes Provision for income taxes Net income As a % of total revenue Earnings per share Basic Diluted Weighted average common shares outstanding Basic Diluted Selected Balance Sheet Data In millions of dollars, except for per share items 2017 2016 2015 2014 2011 $4.476.4 $3.904.4 $4.501.2 $4,108.3 $2.269.6 1.535.4 1.3656 1,503.8 1.4210 738.7 343% 50% 33.4% 3462 32.5% 1.206.0 1.105.0 1.045.7 904.4 543.1 26.9% 28.3% 23.2% 22.2% 23.9% 327.1 293.6 2624 230.9 147.3 73% 7.3% 5.81 5.6% 6.5% 651.6 6420 515.0 4342 2512 14.6% 16.4% 11.45 10.6% 11.1% 296.4 2762 250.2 2739 149.4 6.6% 7.1% 56% 6.7% 66% 1633 146.4 130.4 1105 749 123 172 169 156 85 13.3 239 12.194 6.976 5.806 4.206.6 3.869.8 3.7376 3.7376 3.3975 1.9190 270.8 34.6 7636 710.8 3506 6.0% 0.9% 17.01 17.3 15.5% 42 10.9) 275.7 38.7 769.9 7143 349 7 199.5) (158) 2943) 268.9 (1349) $ 176.3 $ 22.9 54756 $4454 $ 2149 3.9% 0.6% 10.6% 10.8% 9.5% 6.3 3.5 $ $ $ $ $ 6.19 6.17 0.78 0.77 15.30 15.10 14.35 14.13 6.89 6.76 28.5 286 29.3 31. 1 31.5 31.0 31.5 312 318 29.8 Total current assets Total assets Total current liabilities Total liabilities Total shareholders' equity $ 629.5 2,045.7 3239 6812 1,364.4 $ 5224 2.026.1 281.8 623.6 1.402.5 S 8146 2.725.1 279.9 597.1 2.128. 0 $ 859.5 2.5273 245.7 5149 2.0124 $ 501.2 1.425.3 157.5 374.8 1.0442 Other Financial Data Net cash provided by operating activities Capital expenditures $ 467.1 216.8 $ 411.1 151.1 Restaurant Operations Data $ 349.2 $ 683.3 $ 682.1 258.8 257,4 252.6 In thousands of dollars 2.250 2,010 1.783 $1,868,0 $2,424,0 $2,472,0 2,408 $1,940,0 1.230 $2,013.0 Restaurants open at year-end Average restaurant sales Average annual sales increases at restaurants open at least 13 full calendar months Development and construction costs per newly opened restaurant 6.4% 835 $ $ (20.47% 8805 0.2% 805 $ 16,8% 843 $ 11.2% 800 Chipotle Mexican Grill's Strategy in 2018: Will the New CEO Be Able to Rebuild Customer Trust and Revive Sales Growth? Business Case 12 available online at https://calstatela libguides.com/BUS4970 with the password strategy 1.) What are the key elements of the company's business strategy to compete with other market players? 2.) Identify different social and economic trends that can present either opportunities or challenges to the company 3.) Provide and evaluate the compa y's financial ratios (as listed below) for fiscal years 2011-2017 (a) Current Ratio (b) Return on Equity (c) Debt-to-Asset Ratio Briefly discuss what these individual financial ratios show and what their year-to-year changes tell us about the financial conditions of the company. EXHIBIT 1 Financial and Operating Highlights for Chipotle Mexican Grill, 2011-2017 Income Statement Data Total revenue Food, beverage, and packaging costs As a % of total revenue Labor costs As a % of total revenue Occupancy costs As a % of total revenue Other operating costs As a % of total revenue General and administrative expenses As a % of total revenue Depreciation and amortization Pre-opening costs Loss on disposal of assets Total operating expenses Operating income As a % of total revenue Interest and other income (expense) net Income before income taxes Provision for income taxes Net income As a % of total revenue Earnings per share Basic Diluted Weighted average common shares outstanding Basic Diluted Selected Balance Sheet Data Total current assets Total assets Total current liabilities Total liabilities Total shareholders' equity Other Financial Data In millions of dollars, except for per share items 2017 2016 2015 2014 2011 $4,4764 $3.9044 $4.501.2 $4.108.3 $2.269.6 1.535.4 1.3656 1.503.8 1.421.0 738.7 34 35 50% 33.4% 34.6% 32.5% 1.206.0 1.105.0 1.045.7 904.4 543.1 26.9% 28.3% 23.2% 22.2% 23.9% 327.1 293.6 262.4 230.9 147.3 7.3% 7.3% 5.8% 5.6% 6.5% 651.6 6420 515.0 4342 251.2 14.6% 16,4% 11.4% 10.6% 11.15 296.4 2762 250.2 273.9 149.4 6.6% 7.1% 5.6% 6.7% 66% 163.3 146.4 130.4 110.5 74.9 12.3 172 16.9 15.6 85 13.3 23.9 13,194 6.976 5,806 4.206.6 3.869.8 3.737.6 3.397.5 1.9190 270.8 34.6 763.6 7108 3506 6.0% 0.9% 17.0% 17.3% 15.5% 4.9 6.3 3.5 10.9) 275.7 38.7 769.9 714.3 349.7 199.5) (158) (294.3) 268.9) (1349) $ 176.3 $ 22.9 $ 475.6 $445.4 $ 214.9 3.9% 0.6% 10.6% 10.8% 9.5% 42 $ $ $ $ $ 6.19 6.17 0.78 0.77 15.30 15.10 14.35 14.13 6.89 6.76 28.5 28.6 29.3 29.8 31.1 31.5 310 31.5 31.2 31.8 $ 629.5 2,045.7 323. 9 6812 1,364.4 $ 522.4 2.026.1 2 81.8 623.6 1.402.5 $ 814.6 2.725.1 279.9 597.1 2.128. 0 $ 859.5 2.527.3 245.7 514.9 2.012.4 $ 501.2 1.425.3 157.5 374.8 1.0442 Net cash provided by operating activities Capital expenditures Restaurant Operations Data $ 467.1 216.8 $ 411.1 151.1 $ 349.2 $ 683.3 $ 682.1 258.8 257,4 2526 In thousands of dollars 2.250 2,010 1.783 $1,868.0 $2,424.0 $2,472,0 2,408 $1,940,0 1.230 $2,013.0 Restaurants open at year-end Average restaurant sales Average annual sales increases at restaurants open at least 13 full calendar months Development and construction costs per newly opened restaurant $ 6.4% 835 $ (20.4)% 880 $ 0.2% 805 $ 16.8% 843 $ 11.2% 800


