Please attach excel document. Thank you!!
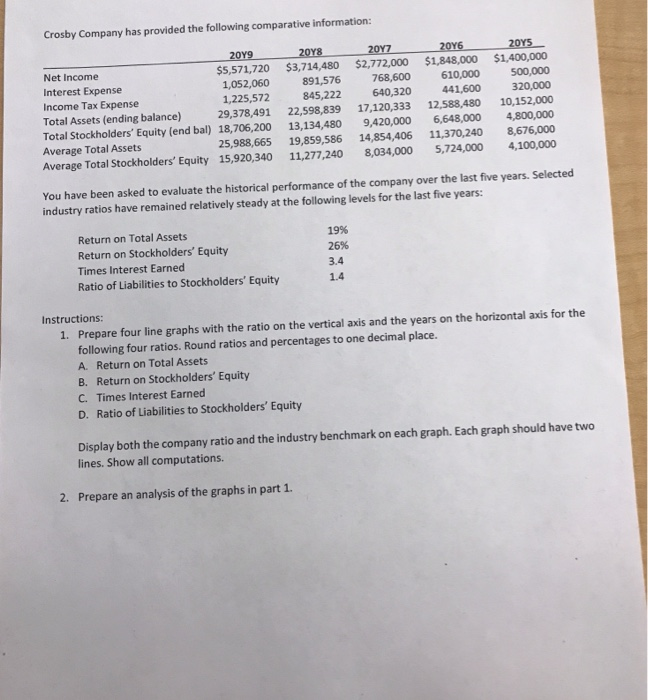
Crosby Company has provided the following comparative information: 20Y8 Net Income Interest Expense Income Tax Expense Total Assets (ending balance) Total Stockholders' Equity (end bal) 18,706,200 13,134,480 9,420,000 6,648,000 4,800,000 Average Total Assets Average Total Stockholders' Equity 15,920,340 11,277,240 8,034,000 5,724,000 4,100,000 $5,571,720 $3,714,480 $2,772,000 $1,848,000 $1,400,000 891,576 768,600 610,000 500,000 1,225,572 845,222 640,320 441,600 320,000 29,378,491 22,598,839 17,120,333 12,588,480 10,152,000 1,052,060 25,988,665 19,859,586 14,854,406 11,370,240 8,676,000 You have been asked to evaluate the historical performance of the company over the last five years. Selected industry ratios have remained relatively steady at the following levels for the last five years: Return on Total Assets Return on Stockholders' Equity Times Interest Earned Ratio of Liabilities to Stockholders' Equity 19% 26% 3.4 1.4 Instructions: Prepare four line graphs with the ratio on the vertical axis and the years on the horizontal axis for the following four ratios. Round ratios and percentages to one decimal place. A. Return on Total Assets B. Return on Stockholders' Equity C. Times Interest Earned D. Ratio of Liabilities to Stockholders' Equity 1. Display both the company ratio and the industry benchmark on each graph. Each graph should have two lines. Show all computations. 2. Prepare an analysis of the graphs in part 1 Crosby Company has provided the following comparative information: 20Y8 Net Income Interest Expense Income Tax Expense Total Assets (ending balance) Total Stockholders' Equity (end bal) 18,706,200 13,134,480 9,420,000 6,648,000 4,800,000 Average Total Assets Average Total Stockholders' Equity 15,920,340 11,277,240 8,034,000 5,724,000 4,100,000 $5,571,720 $3,714,480 $2,772,000 $1,848,000 $1,400,000 891,576 768,600 610,000 500,000 1,225,572 845,222 640,320 441,600 320,000 29,378,491 22,598,839 17,120,333 12,588,480 10,152,000 1,052,060 25,988,665 19,859,586 14,854,406 11,370,240 8,676,000 You have been asked to evaluate the historical performance of the company over the last five years. Selected industry ratios have remained relatively steady at the following levels for the last five years: Return on Total Assets Return on Stockholders' Equity Times Interest Earned Ratio of Liabilities to Stockholders' Equity 19% 26% 3.4 1.4 Instructions: Prepare four line graphs with the ratio on the vertical axis and the years on the horizontal axis for the following four ratios. Round ratios and percentages to one decimal place. A. Return on Total Assets B. Return on Stockholders' Equity C. Times Interest Earned D. Ratio of Liabilities to Stockholders' Equity 1. Display both the company ratio and the industry benchmark on each graph. Each graph should have two lines. Show all computations. 2. Prepare an analysis of the graphs in