Answered step by step
Verified Expert Solution
Link Copied!

Question

1 Approved Answer

please attach the sensitivity graph, calculate all the NPV values. please solve step by step in detailed manner. show the formula whereever it is required.
please attach the sensitivity graph, calculate all the NPV values. please solve step by step in detailed manner. show the formula whereever it is required.
image text in transcribed
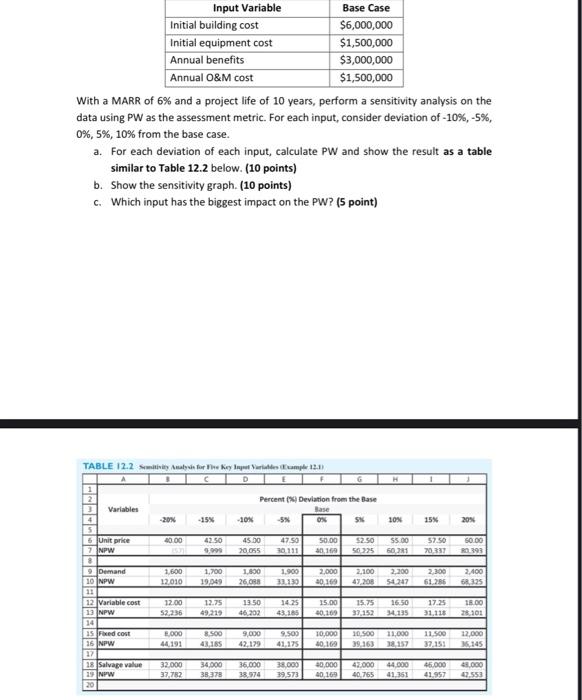
With a MARR of 6% and a project life of 10 years, perform a sensitivity analysis on the data using PW as the assessment metric. For each input, consider deviation of 10%,5%, 0%,5%,10% from the base case. a. For each deviation of each input, calculate PW and show the result as a table similar to Table 12.2 below. (10 points) b. Show the sensitivity graph. (10 points) c. Which input has the biggest impact on the PW? (5 point)

Step by Step Solution

There are 3 Steps involved in it

Step: 1

blur-text-image

Get Instant Access to Expert-Tailored Solutions

See step-by-step solutions with expert insights and AI powered tools for academic success

Step: 2

blur-text-image_2

Step: 3

blur-text-image_3

Ace Your Homework with AI

Get the answers you need in no time with our AI-driven, step-by-step assistance

Get Started

Recommended Textbook for

Audit Planning Conduct And Closure Of Issues For Successful Resolution

Authors: Bincy Abraham, Imran Chaki, Naisarg Pujara

1st Edition

6200484961, 978-6200484963

More Books

Students also viewed these Accounting questions

Question

Identify how culture affects appropriate leadership behavior

Answered: 1 week ago