

Answered step by step
Verified Expert Solution
Question
1 Approved Answer
Please be specific with plot numbers for the graph 3. Equilibrium in the market for loanable funds The following tables present a hypothetical economy's data
Please be specific with plot numbers for the graph 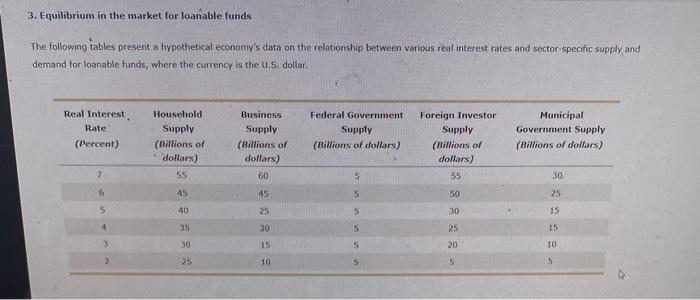
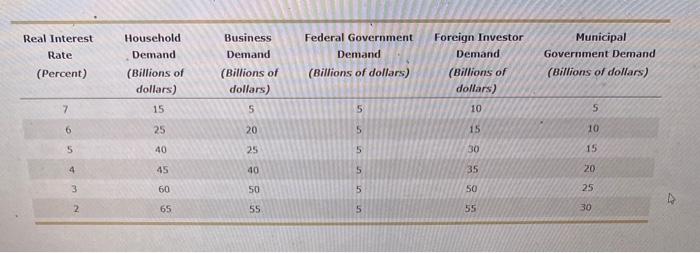
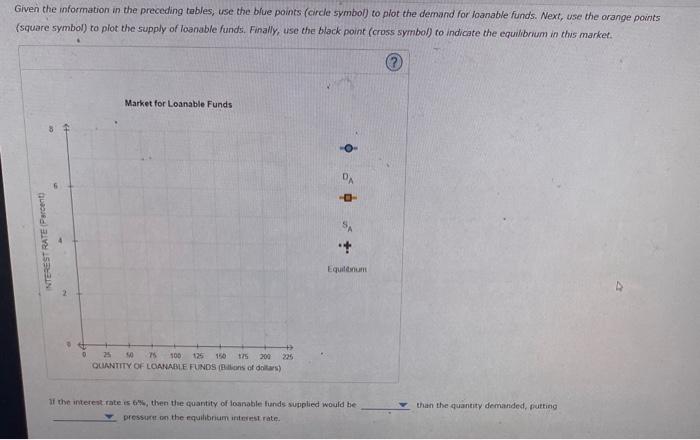
3. Equilibrium in the market for loanable funds The following tables present a hypothetical economy's data on the relationship between various real interest rates and sector specific supply and demand for loanable funds, where the currency is the U.S. dollar. Given the information in the preceding tables, use the bfue points (circle symbol) to plot the demand for loanable funds. Next, use the orange povits \{square symbol) to piot the supply of loanable funds. Finally, use the black point (cross symbol) to indicate the equibbrum in this market. If the interest rate is 6 s. then the quantity of loanable fands supplied would be than the quantity demanded, purting pressurt on the equilibnum interimt rate Step by Step Solution
There are 3 Steps involved in it
Step: 1

Get Instant Access to Expert-Tailored Solutions
See step-by-step solutions with expert insights and AI powered tools for academic success
Step: 2

Step: 3
Ace Your Homework with AI
Get the answers you need in no time with our AI-driven, step-by-step assistance
Get Started
Recent Advances And Applications In Alternative Investments
Authors: Constantin Zopounidis, Dimitris Kenourgios ,George Dotsis
1st Edition
1799824365,179982439X