

Answered step by step
Verified Expert Solution
Question
1 Approved Answer
Please calculate Breakeven variable costs selling price unit contribution Weighted Average Unit and Contribution Thank you EXHIBIT 3: PRICING AND SALES DISTRIBUTION (IN CAS) Item
Please calculate Breakeven variable costs selling price unit contribution Weighted Average Unit and Contribution Thank you 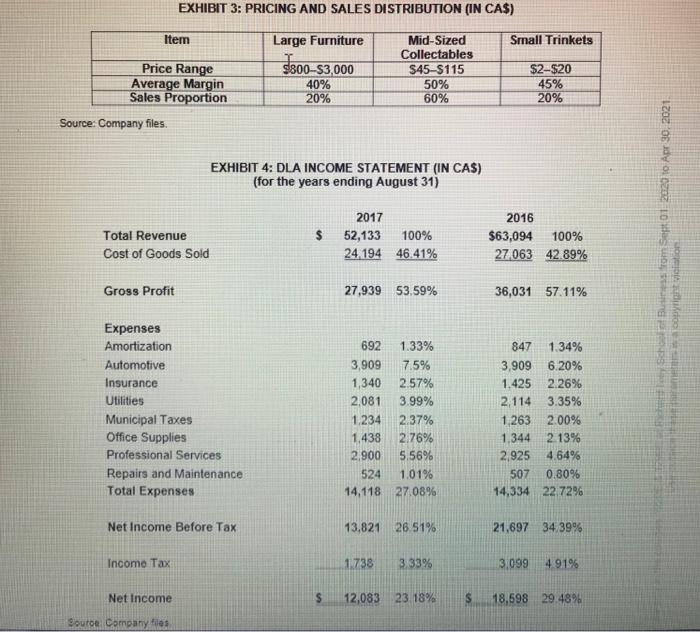 EXHIBIT 3: PRICING AND SALES DISTRIBUTION (IN CAS) Item Large Furniture Small Trinkets 1800-$3,000 Price Range Average Margin Sales Proportion Mid-Sized Collectables S45-S115 50% 60% 40% 20% $2-$20 45% 20% Source: Company files. EXHIBIT 4: DLA INCOME STATEMENT (IN CAS) (for the years ending August 31) $ Total Revenue Cost of Goods Sold 2017 52,133 100% 24 194 46.41% 2016 $63,094 100% 27.063 42.89% Schoom Set 01 2029 to Apr 30, 2021, copyright to Gross Profit 27,939 53.59% 36,031 57.11% Expenses Amortization Automotive Insurance Utilities Municipal Taxes Office Supplies Professional Services Repairs and Maintenance Total Expenses 692 1.33% 3,909 7.5% 1,340 2.57% 2,081 3.99% 1.234 2.37% 1,438 2.76% 2.900 5.56% 524 1.01% 14,118 27.08% 847 1.34% 3,909 6.20% 1.425 2.26% 2.114 3.35% 1 2632.00% 1,344 2.13% 2.925 4.64% 507 0.80% 14,334 22 72% Net Income Before Tax 13,821 26 51% 21,697 34.39% Income Tax 1.738 3.33% 3.099 4.91% Net Income S 12,083 23 18% S 18.598 29.48% Souton Company files EXHIBIT 3: PRICING AND SALES DISTRIBUTION (IN CAS) Item Large Furniture Small Trinkets 1800-$3,000 Price Range Average Margin Sales Proportion Mid-Sized Collectables S45-S115 50% 60% 40% 20% $2-$20 45% 20% Source: Company files. EXHIBIT 4: DLA INCOME STATEMENT (IN CAS) (for the years ending August 31) $ Total Revenue Cost of Goods Sold 2017 52,133 100% 24 194 46.41% 2016 $63,094 100% 27.063 42.89% Schoom Set 01 2029 to Apr 30, 2021, copyright to Gross Profit 27,939 53.59% 36,031 57.11% Expenses Amortization Automotive Insurance Utilities Municipal Taxes Office Supplies Professional Services Repairs and Maintenance Total Expenses 692 1.33% 3,909 7.5% 1,340 2.57% 2,081 3.99% 1.234 2.37% 1,438 2.76% 2.900 5.56% 524 1.01% 14,118 27.08% 847 1.34% 3,909 6.20% 1.425 2.26% 2.114 3.35% 1 2632.00% 1,344 2.13% 2.925 4.64% 507 0.80% 14,334 22 72% Net Income Before Tax 13,821 26 51% 21,697 34.39% Income Tax 1.738 3.33% 3.099 4.91% Net Income S 12,083 23 18% S 18.598 29.48% Souton Company files
Please calculate Breakeven variable costs selling price unit contribution Weighted Average Unit and Contribution
Thank you
Step by Step Solution
There are 3 Steps involved in it
Step: 1

Get Instant Access to Expert-Tailored Solutions
See step-by-step solutions with expert insights and AI powered tools for academic success
Step: 2

Step: 3
Ace Your Homework with AI
Get the answers you need in no time with our AI-driven, step-by-step assistance
Get Started
Robonomics Prepare Today For The Jobless Economy Of Tomorrow
Authors: John Crews
1st Edition
1530910463, 978-1530910465