Answered step by step
Verified Expert Solution
Question
1 Approved Answer
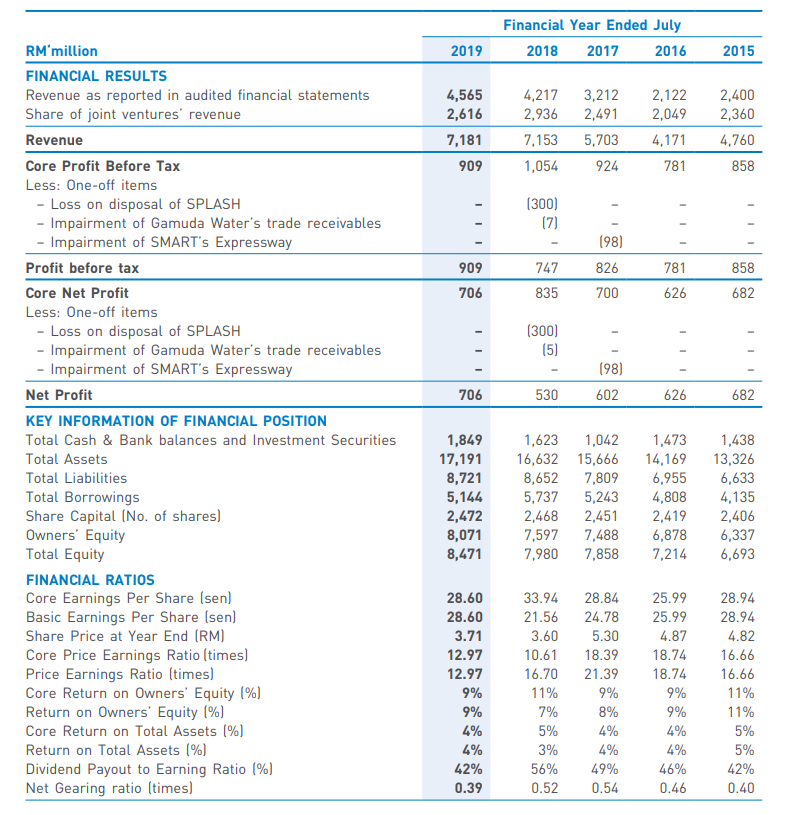
Please calculate the following financial figures for year 2019 based on the financial statement attached for this company. ( With workings ) % Return on
Please calculate the following financial figures for year 2019 based on the financial statement attached for this company. ( With workings )
- % Return on capital employed
- Asset turnover (times)
- Net profit margin (%)
- Current ratio
- Acid test ratio
- Accounts Receivables Collection Period (days)
- Account Payables Collection Period (days)
- Gearing ratio (%)

RM'million FINANCIAL RESULTS Revenue as reported in audited financial statements Share of joint ventures' revenue Revenue Core Profit Before Tax Less: One-off items - Loss on disposal of SPLASH - Impairment of Gamuda Water's trade receivables - Impairment of SMART's Expressway Profit before tax Core Net Profit Less: One-off items - Loss on disposal of SPLASH - Impairment of Gamuda Water's trade receivables - Impairment of SMART's Expressway Net Profit KEY INFORMATION OF FINANCIAL POSITION Total Cash & Bank balances and Investment Securities Total Assets Total Liabilities Total Borrowings Share Capital (No. of shares) Owners' Equity Total Equity FINANCIAL RATIOS Core Earnings Per Share (sen) Basic Earnings Per Share (sen) Share Price at Year End (RM) Core Price Earnings Ratio (times) Price Earnings Ratio (times) Core Return on Owners' Equity (%) Return on Owners' Equity (%) Core Return on Total Assets [%] Return on Total Assets (%) Dividend Payout to Earning Ratio (%) Net Gearing ratio (times) 2019 4,565 2,616 7,181 909 909 706 706 1,849 17,191 8,721 5,144 2,472 8,071 8,471 28.60 28.60 3.71 12.97 12.97 9% 9% 4% 4% 42% 0.39 Financial Year Ended July 2018 2017 2016 4,217 3,212 2,936 2,491 2,122 2,049 7,153 5,703 4,171 1,054 924 781 (300) (7) 747 826 835 700 (300) (5) (98) 530 (98) 602 1,623 1,042 16,632 15,666 8,652 7,809 5,737 5,243 2,468 2,451 7,597 7,488 7,980 7,858 33.94 28.84 21.56 24.78 3.60 10.61 16.70 11% 7% 5% 3% 56% 5.30 18.39 21.39 9% 8% 4% 4% 49% 0.52 0.54 781 626 626 1,473 14,169 6,955 4,808 2,419 6,878 7,214 25.99 25.99 4.87 18.74 18.74 9% 9% 4% 4% 46% 0.46 2015 2,400 2,360 4,760 858 858 682 682 1,438 13,326 6,633 4,135 2,406 6,337 6,693 28.94 28.94 4.82 16.66 16.66 11% 11% 5% 5% 42% 0.40
Step by Step Solution
★★★★★
3.39 Rating (143 Votes )
There are 3 Steps involved in it
Step: 1
To calculate the financial figures for 2019 based on the given financial statement we can use the following formulas 1 Return on Capital Employed Retu...
Get Instant Access to Expert-Tailored Solutions
See step-by-step solutions with expert insights and AI powered tools for academic success
Step: 2

Step: 3

Ace Your Homework with AI
Get the answers you need in no time with our AI-driven, step-by-step assistance
Get Started


