

Answered step by step
Verified Expert Solution
Question
1 Approved Answer
Please calculate the NPV with the figures below begin{tabular}{|c|c|c|c|c|c|c|c|c|c|c|c|} hline multicolumn{12}{|l|}{1 Assumptions } hline Capital Expenditure & 1,500 & multicolumn{10}{|l|}{ USD million }
Please calculate the NPV with the figures below
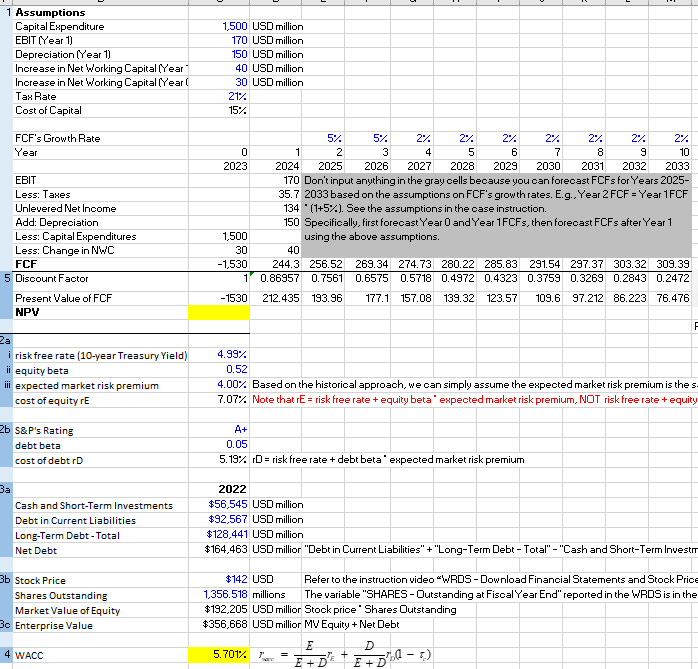 \begin{tabular}{|c|c|c|c|c|c|c|c|c|c|c|c|} \hline \multicolumn{12}{|l|}{1 Assumptions } \\ \hline Capital Expenditure & 1,500 & \multicolumn{10}{|l|}{ USD million } \\ \hline EBIT (Year 1) & 170 & \multicolumn{10}{|l|}{ USD million } \\ \hline Depreciation (Year 1) & 150 & \multicolumn{10}{|l|}{ USD million } \\ \hline Increase in Net Working Capital (Year - & 40 & \multicolumn{10}{|l|}{ USD million } \\ \hline Increase in Net Working Capital (Year l & 30 & \multicolumn{10}{|l|}{ USD million } \\ \hline Tax Rate & 21% & & & & & & & & & & \\ \hline Cost of Capital & 15% & & & & & & & & & & \\ \hline FCF's Growth Rate & & & 5% & 5% & 2% & 2% & 2% & 2% & 2% & 2% & 2% \\ \hline Year & 0 & 1 & 2 & 3 & 4 & 5 & 6 & 7 & 8 & 9 & 10 \\ \hline & 2023 & 2024 & 2025 & 2026 & 2027 & 2028 & 2029 & 2030 & 2031 & 2032 & 2033 \\ \hline EBIT & & 170 & \multicolumn{9}{|c|}{ Don't input anything in the gray cells because you can forecast FCFs for Years 2025- } \\ \hline Less: Takes & & 35.7 & \multicolumn{9}{|c|}{2033 based on the assumptions on FCF's grow thrates. E.g. Year 2FCF= Year 1FCF} \\ \hline Unlevered Net Income & & 134 & \multicolumn{9}{|c|}{ * (1+5%). See the assumptions in the case instruction. } \\ \hline Add: Depreciation & & 150 & \multirow{3}{*}{\multicolumn{9}{|c|}{\begin{tabular}{l} Specifically, first forecast Year 0 and Year 1FCF s, then forecast FCFs after Year 1 \\ using the above assumptions. \end{tabular}}} \\ \hline Less: Capital Expenditures & 1,500 & & & & & & & & & & \\ \hline Less: Change in NWC & 30 & 40 & & & & & & & & & \\ \hline FCF & 1,530 & 244.3 & 256.52 & 269.34 & 274.73 & 280.22 & 285.83 & 291.54 & 297.37 & 303.32 & 309.39 \\ \hline 5 Discount Factor & 1 & 0.86957 & 0.7561 & 0.6575 & 0.5718 & 0.4972 & 0.4323 & 0.3759 & 0.3269 & 0.2843 & 0.2472 \\ \hline Present Value of FCF & -1530 & 212.435 & 193.96 & 177.1 & 157.08 & 139.32 & 123.57 & 109.6 & 97.212 & 86.223 & 76.476 \\ \hline \multicolumn{12}{|l|}{ NPV } \\ \hline & & & & & & & & & & & \\ \hline \multicolumn{12}{|l|}{a} \\ \hline i risk free rate (10-year Treasury Yield) & 4.99% & & & & & & & & & & \\ \hline ii equity beta & 0.52 & & & & & & & & & & \\ \hline iii expected market risk premium & 4.00% & \multirow{2}{*}{\multicolumn{10}{|c|}{\begin{tabular}{l} Based on the historical approach, we can simply assume the expected market risk premium is the s. \\ Note that rE = risk free rate + equity beta " expected market risk premium, NOT risk free rate + equity \end{tabular}}} \\ \hline cost of equity rE & 7.07% & & & & & & & & & & \\ \hline & & & & & & & & & & & \\ \hline b S\&.P's Rating & A+ & & & & & & & & & & \\ \hline debt beta & 0.05 & & & & & & & & & & \\ \hline cost of debt rD & 5.19% & \multicolumn{10}{|c|}{rD= risk free rate + debt beta expected market risk premium } \\ \hline & & & & & & & & & & & \\ \hline & 2022 & & & & & & & & & & \\ \hline Cash and Short-Term Investments & $56,545 & \multicolumn{10}{|l|}{ USD million } \\ \hline Debt in Current Liabilities & $92,567 & \multicolumn{10}{|l|}{ USD million } \\ \hline Long-Term Debt - Total & $128,441 & \\ \hline Net Debt & $164,463 & \multicolumn{10}{|c|}{ USD millior "Debt in Current Liabilities" + "Long-Term Debt - Total" - "Cash and Short-Term Investr } \\ \hline b Stock Price & $142 & USD & \multicolumn{9}{|c|}{ Refer to the instruction video "WRDS - Download Financial Statements and Stock Price } \\ \hline Shares Outstanding & 1,356.518 & millions & \multicolumn{9}{|c|}{ The variable "SHARES - Dutstanding at Fiscal Year End" reported in the WRDS is in the } \\ \hline Market Value of Equity & $192,205 & \multicolumn{10}{|c|}{ USD millior Stock price" Shares Dutstanding } \\ \hline ic Enterprise Value & $356,668 & \multicolumn{4}{|c|}{ USD millior MVEquity + Net Debt } & & & & & & \\ \hline & & & E & D & & & & & & & \\ \hline 4 WACC & 5.701% & rmix= & 1+DELrE+ & E+DDT & (1c) & & & & & & \\ \hline \end{tabular}
 Step by Step Solution
There are 3 Steps involved in it
Step: 1

Get Instant Access to Expert-Tailored Solutions
See step-by-step solutions with expert insights and AI powered tools for academic success
Step: 2

Step: 3
Ace Your Homework with AI
Get the answers you need in no time with our AI-driven, step-by-step assistance
Get Started
Foundations Of Financial Markets And Institutions
Authors: Frank J Fabozzi, Franco G Modigliani, Frank J Jones
4th Edition
0136135315, 978-0136135319