

Answered step by step
Verified Expert Solution
Question
1 Approved Answer
Please calculate the remaining tables using the Annual Sales table. Answer the question of Over the time period, how has the company done in sales
Please calculate the remaining tables using the Annual Sales table. Answer the question of "Over the time period, how has the company done in sales and in profits? 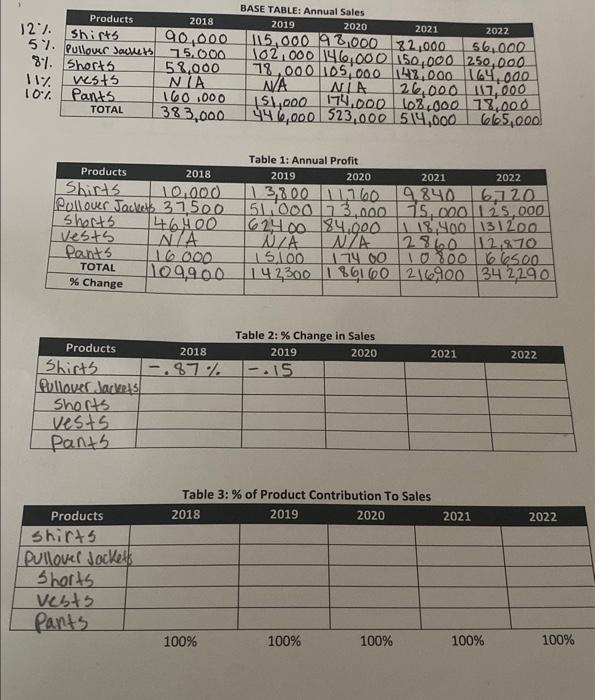
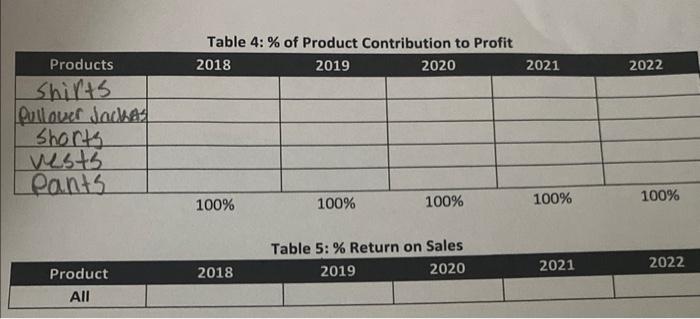
\begin{tabular}{|l|l|l|l|l|l|} \hline \multicolumn{5}{|c|}{ Table 2: \% Change in Sales } \\ \hline Products & 2018 & 2019 & 2020 & 2021 & 2022 \\ \hline Shirts & .87% & -.15 & & & \\ \hline Pullover Jackets & & & & & \\ \hline Shorts & & & & & \\ \hline VeStS & & & & & \\ \hline Pants & & & & & \\ \hline \end{tabular} Table 3: \% of Product Contribution To Sales Table 5: \% Return on Sales Step by Step Solution
There are 3 Steps involved in it
Step: 1

Get Instant Access to Expert-Tailored Solutions
See step-by-step solutions with expert insights and AI powered tools for academic success
Step: 2

Step: 3
Ace Your Homework with AI
Get the answers you need in no time with our AI-driven, step-by-step assistance
Get Started
Handbook Of Economic Growth Volume 2A
Authors: Philippe Aghion , Steven Durlauf
1st Edition
0444535462,0444535470