Please can provide steps to do the model in the aplication SIM QUICK?
After analyzing the exercise please guide me step by step to make the model with the SIM QUICK application
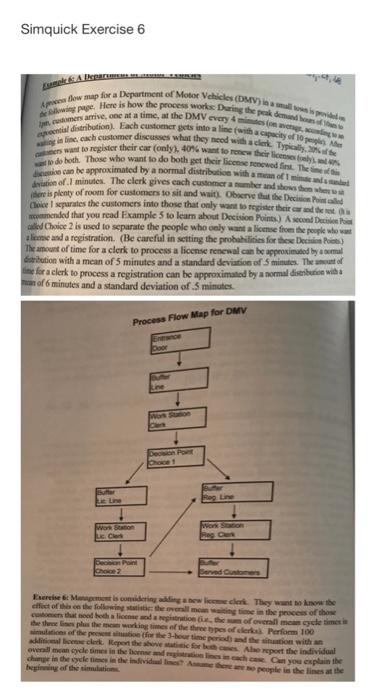
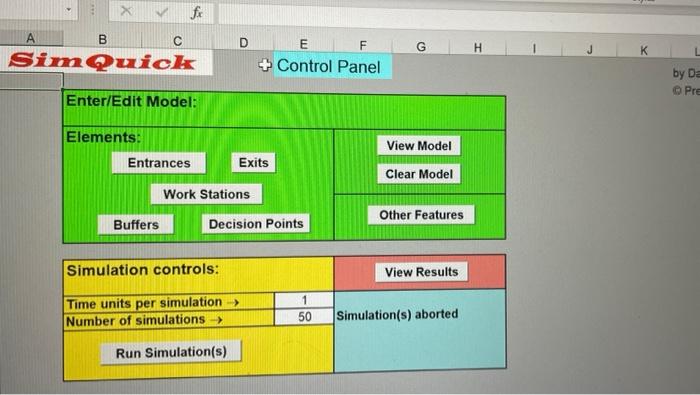
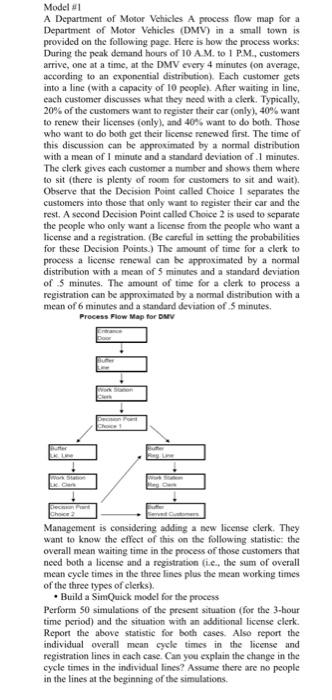
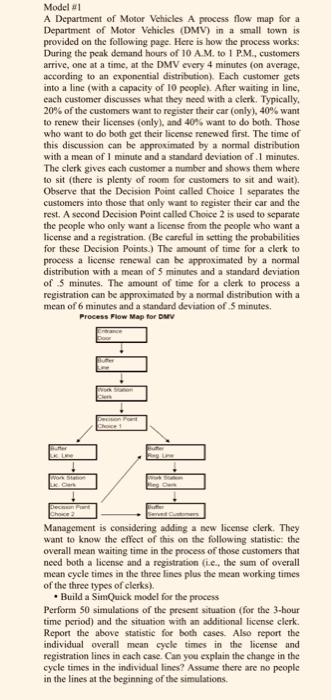
Simquick Exercise 6 Lumel & A 14% delowing page. Here is how the process works: During the peak demand hours of Aproces flow map for a Department of Motor Vehicles (DMV) in a small town is provided pontial distribution). Each customer gets into a line (with a capacity of 10 customers arrive, one at a time, at the DMV every 4 minutes (on average, aconding aners want to register their car (only), 40% want to renew their licenses onlys, a ating in line, cach customer discusses what they need with a clerk. Typically, sat to do both. Those who want to do both get their license renewed fint. The times dion can be approximated by a normal distribution with a mean of I mi deviation of .1 minutes. The clerk gives each customer a number and shows there is plenty of room for customers to sit and wait). Observe that the Decision Point called Choice 1 separates the customers into those that only want to register their car and the rest is commended that you read Example 5 to learn about Decision Points) A second Decision Poi called Choice 2 is used to separate the people who only want a license from the people who want aliese and a registration. (Be careful in setting the probabilities for these Decision Points) The amount of time for a clerk to process a license renewal can be approximated by a normal distribution with a mean of 5 minutes and a standard deviation of 5 minutes. The amount of time for a clerk to process a registration can be approximated by a normal distribution with a man of 6 minutes and a standard deviation of 5 minutes. del Process Flow Map for DMV Entrance Door Work Station Clerm Choice 1 0-0-0 Reg Line Work Station Butter Served Customers Exercise & Management is considering adding a new liceme clerk. They want to know the effect of this on the following statistic: the overall mean waiting time in the process of those customers that nood both a license and a registration the three lines plus the mean working times of the three types of clerks). Perform 100 the sum of overall mean cycle times in simulations of the present situation for the 3-hour time period) and the situation with an additional license clerk Report the above statistic for both cases. Also report the individual overall mean cycle times in the license and registration lines in each case. Can you explain the change in the cycle times in the individual lines? Ame there are no people in the lines at the beginaming of the sulatiom Lic Line Work Station Le Clerk Decision Point Choice 2 fx A B C Sim Quick Enter/Edit Model: Elements: Entrances D Work Stations Buffers Simulation controls: Time units per simulation > Number of simulations -> Run Simulation(s) F E +Control Panel Exits Decision Points 1 50 View Model Clear Model Other Features View Results Simulation(s) aborted K by Da Pre Model #1 A Department of Motor Vehicles A process flow map for a Department of Motor Vehicles (DMV) in a small town is provided on the following page. Here is how the process works: During the peak demand hours of 10 A.M. to 1 P.M., customers arrive, one at a time, at the DMV every 4 minutes (on average, according to an exponential distribution). Each customer gets into a line (with a capacity of 10 people). After waiting in line, each customer discusses what they need with a clerk. Typically, 20% of the customers want to register their car (only), 40% want to renew their licenses (only), and 40% want to do both. Those who want to do both get their license renewed first. The time of this discussion can be approximated by a normal distribution with a mean of 1 minute and a standard deviation of .1 minutes. The clerk gives each customer a number and shows them where to sit (there is plenty of room for customers to sit and wait). Observe that the Decision Point called Choice I separates the customers into those that only want to register their car and the rest. A second Decision Point called Choice 2 is used to separate the people who only want a license from the people who want a license and a registration. (Be careful in setting the probabilities for these Decision Points.) The amount of time for a clerk to process a license renewal can be approximated by a normal distribution with a mean of 5 minutes and a standard deviation of 5 minutes. The amount of time for a clerk to process a registration can be approximated by a normal distribution with a mean of 6 minutes and a standard deviation of .5 minutes. Process Flow Map for DMV Butter Work Station LK. C Decision Pant Choice 2 Management is considering adding a new license clerk. They want to know the effect of this on the following statistic: the overall mean waiting time in the process of those customers that need both a license and a registration (i.e., the sum of overall mean cycle times in the three lines plus the mean working times of the three types of clerks). Build a SimQuick model for the process Perform 50 simulations of the present situation (for the 3-hour- time period) and the situation with an additional license clerk. Report the above statistic for both cases. Also report the individual overall mean cycle times in the license and registration lines in each case. Can you explain the change in the cycle times in the individual lines? Assume there are no people in the lines at the beginning of the simulations. 0-0-0-0 Model #1 A Department of Motor Vehicles A process flow map for a Department of Motor Vehicles (DMV) in a small town is provided on the following page. Here is how the process works: During the peak demand hours of 10 A.M. to 1 P.M., customers arrive, one at a time, at the DMV every 4 minutes (on average, according to an exponential distribution). Each customer gets into a line (with a capacity of 10 people). After waiting in line, each customer discusses what they need with a clerk. Typically, 20% of the customers want to register their car (only), 40% want to renew their licenses (only), and 40% want to do both. Those who want to do both get their license renewed first. The time of this discussion can be approximated by a normal distribution with a mean of 1 minute and a standard deviation of .1 minutes. The clerk gives each customer a number and shows them where to sit (there is plenty of room for customers to sit and wait). Observe that the Decision Point called Choice 1 separates the customers into those that only want to register their car and the rest. A second Decision Point called Choice 2 is used to separate the people who only want a license from the people who want a license and a registration. (Be careful in setting the probabilities for these Decision Points.) The amount of time for a clerk to process a license renewal can be approximated by a normal distribution with a mean of 5 minutes and a standard deviation of 5 minutes. The amount of time for a clerk to process a registration can be approximated by a normal distribution with a mean of 6 minutes and a standard deviation of .5 minutes. Process Flow Map for DMV Line Work Station LK: Clark Decos Pant Choice2 Management is considering adding a new license clerk. They want to know the effect of this on the following statistic: the overall mean waiting time in the process of those customers that need both a license and a registration (i.e., the sum of overall mean cycle times in the three lines plus the mean working times of the three types of clerks). Build a SimQuick model for the process Perform 50 simulations of the present situation (for the 3-hour time period) and the situation with an additional license clerk. Report the above statistic for both cases. Also report the individual overall mean cycle times in the license and registration lines in each case. Can you explain the change in the cycle times in the individual lines? Assume there are no people in the lines at the beginning of the simulations. Huffer 0-0-0-0 Simquick Exercise 6 Lumel & A 14% delowing page. Here is how the process works: During the peak demand hours of Aproces flow map for a Department of Motor Vehicles (DMV) in a small town is provided pontial distribution). Each customer gets into a line (with a capacity of 10 customers arrive, one at a time, at the DMV every 4 minutes (on average, aconding aners want to register their car (only), 40% want to renew their licenses onlys, a ating in line, cach customer discusses what they need with a clerk. Typically, sat to do both. Those who want to do both get their license renewed fint. The times dion can be approximated by a normal distribution with a mean of I mi deviation of .1 minutes. The clerk gives each customer a number and shows there is plenty of room for customers to sit and wait). Observe that the Decision Point called Choice 1 separates the customers into those that only want to register their car and the rest is commended that you read Example 5 to learn about Decision Points) A second Decision Poi called Choice 2 is used to separate the people who only want a license from the people who want aliese and a registration. (Be careful in setting the probabilities for these Decision Points) The amount of time for a clerk to process a license renewal can be approximated by a normal distribution with a mean of 5 minutes and a standard deviation of 5 minutes. The amount of time for a clerk to process a registration can be approximated by a normal distribution with a man of 6 minutes and a standard deviation of 5 minutes. del Process Flow Map for DMV Entrance Door Work Station Clerm Choice 1 0-0-0 Reg Line Work Station Butter Served Customers Exercise & Management is considering adding a new liceme clerk. They want to know the effect of this on the following statistic: the overall mean waiting time in the process of those customers that nood both a license and a registration the three lines plus the mean working times of the three types of clerks). Perform 100 the sum of overall mean cycle times in simulations of the present situation for the 3-hour time period) and the situation with an additional license clerk Report the above statistic for both cases. Also report the individual overall mean cycle times in the license and registration lines in each case. Can you explain the change in the cycle times in the individual lines? Ame there are no people in the lines at the beginaming of the sulatiom Lic Line Work Station Le Clerk Decision Point Choice 2 fx A B C Sim Quick Enter/Edit Model: Elements: Entrances D Work Stations Buffers Simulation controls: Time units per simulation > Number of simulations -> Run Simulation(s) F E +Control Panel Exits Decision Points 1 50 View Model Clear Model Other Features View Results Simulation(s) aborted K by Da Pre Model #1 A Department of Motor Vehicles A process flow map for a Department of Motor Vehicles (DMV) in a small town is provided on the following page. Here is how the process works: During the peak demand hours of 10 A.M. to 1 P.M., customers arrive, one at a time, at the DMV every 4 minutes (on average, according to an exponential distribution). Each customer gets into a line (with a capacity of 10 people). After waiting in line, each customer discusses what they need with a clerk. Typically, 20% of the customers want to register their car (only), 40% want to renew their licenses (only), and 40% want to do both. Those who want to do both get their license renewed first. The time of this discussion can be approximated by a normal distribution with a mean of 1 minute and a standard deviation of .1 minutes. The clerk gives each customer a number and shows them where to sit (there is plenty of room for customers to sit and wait). Observe that the Decision Point called Choice I separates the customers into those that only want to register their car and the rest. A second Decision Point called Choice 2 is used to separate the people who only want a license from the people who want a license and a registration. (Be careful in setting the probabilities for these Decision Points.) The amount of time for a clerk to process a license renewal can be approximated by a normal distribution with a mean of 5 minutes and a standard deviation of 5 minutes. The amount of time for a clerk to process a registration can be approximated by a normal distribution with a mean of 6 minutes and a standard deviation of .5 minutes. Process Flow Map for DMV Butter Work Station LK. C Decision Pant Choice 2 Management is considering adding a new license clerk. They want to know the effect of this on the following statistic: the overall mean waiting time in the process of those customers that need both a license and a registration (i.e., the sum of overall mean cycle times in the three lines plus the mean working times of the three types of clerks). Build a SimQuick model for the process Perform 50 simulations of the present situation (for the 3-hour- time period) and the situation with an additional license clerk. Report the above statistic for both cases. Also report the individual overall mean cycle times in the license and registration lines in each case. Can you explain the change in the cycle times in the individual lines? Assume there are no people in the lines at the beginning of the simulations. 0-0-0-0 Model #1 A Department of Motor Vehicles A process flow map for a Department of Motor Vehicles (DMV) in a small town is provided on the following page. Here is how the process works: During the peak demand hours of 10 A.M. to 1 P.M., customers arrive, one at a time, at the DMV every 4 minutes (on average, according to an exponential distribution). Each customer gets into a line (with a capacity of 10 people). After waiting in line, each customer discusses what they need with a clerk. Typically, 20% of the customers want to register their car (only), 40% want to renew their licenses (only), and 40% want to do both. Those who want to do both get their license renewed first. The time of this discussion can be approximated by a normal distribution with a mean of 1 minute and a standard deviation of .1 minutes. The clerk gives each customer a number and shows them where to sit (there is plenty of room for customers to sit and wait). Observe that the Decision Point called Choice 1 separates the customers into those that only want to register their car and the rest. A second Decision Point called Choice 2 is used to separate the people who only want a license from the people who want a license and a registration. (Be careful in setting the probabilities for these Decision Points.) The amount of time for a clerk to process a license renewal can be approximated by a normal distribution with a mean of 5 minutes and a standard deviation of 5 minutes. The amount of time for a clerk to process a registration can be approximated by a normal distribution with a mean of 6 minutes and a standard deviation of .5 minutes. Process Flow Map for DMV Line Work Station LK: Clark Decos Pant Choice2 Management is considering adding a new license clerk. They want to know the effect of this on the following statistic: the overall mean waiting time in the process of those customers that need both a license and a registration (i.e., the sum of overall mean cycle times in the three lines plus the mean working times of the three types of clerks). Build a SimQuick model for the process Perform 50 simulations of the present situation (for the 3-hour time period) and the situation with an additional license clerk. Report the above statistic for both cases. Also report the individual overall mean cycle times in the license and registration lines in each case. Can you explain the change in the cycle times in the individual lines? Assume there are no people in the lines at the beginning of the simulations. Huffer 0-0-0-0