Please complete a ratio analysis for the last fiscal year using at least two ratios from each of the following categories:
A. Liquidity
Current ratio =
Quick ratio =
B. Financial leverage
Debt Equity =
Debt Ratio =
C. Asset Management
Fixed Asset Turnover =
Total asset turnover =
D. Market
Market to book ratio =
Dividend Yield =
Note: I am including the Income Statement, Balance Sheet, and Statement of Cash Flow because I don't know all the information you will need. Please help!!
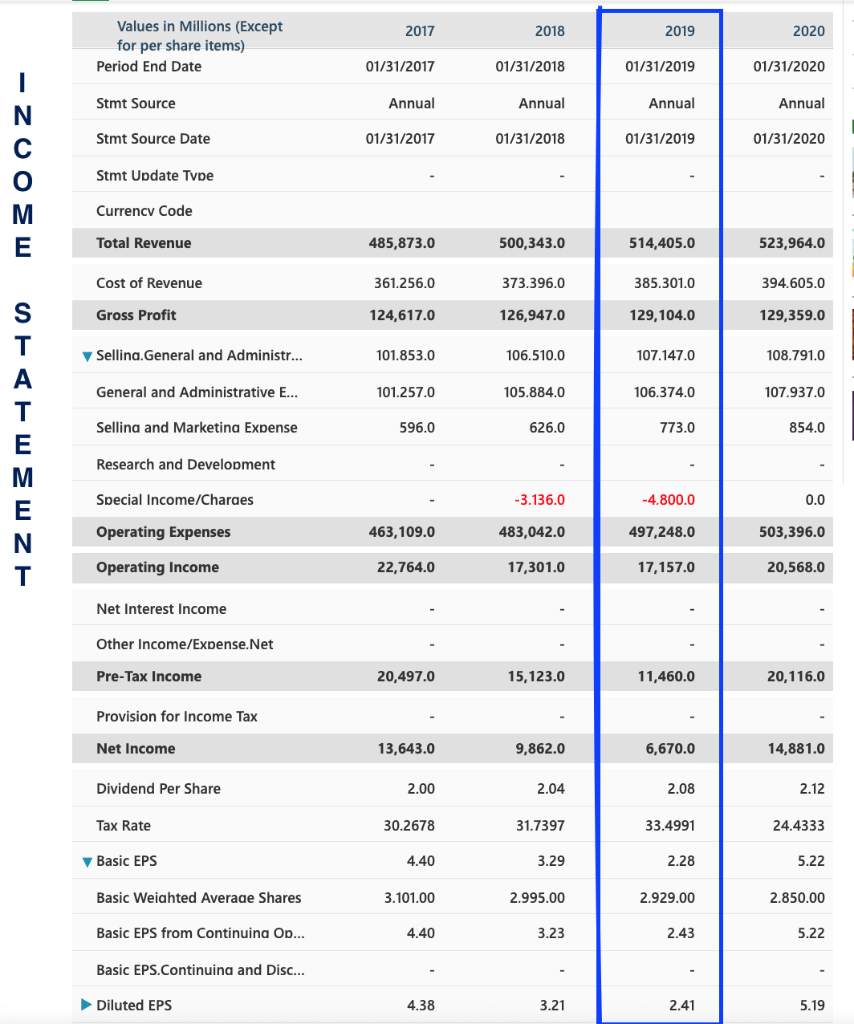
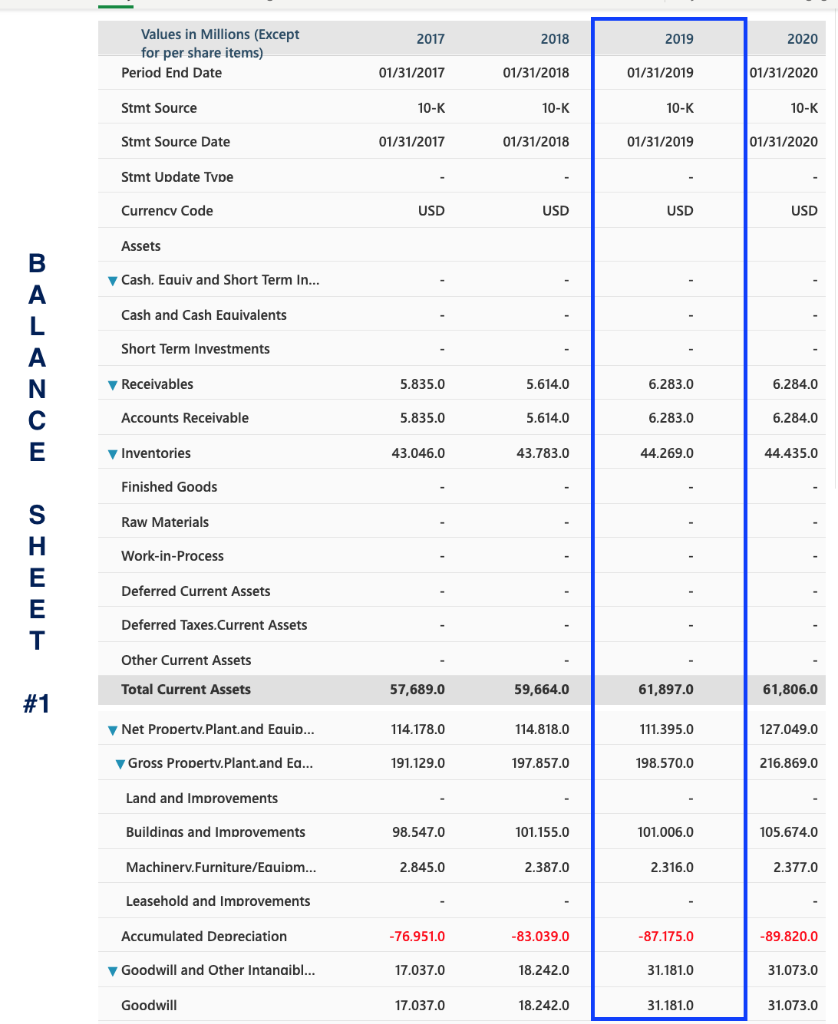
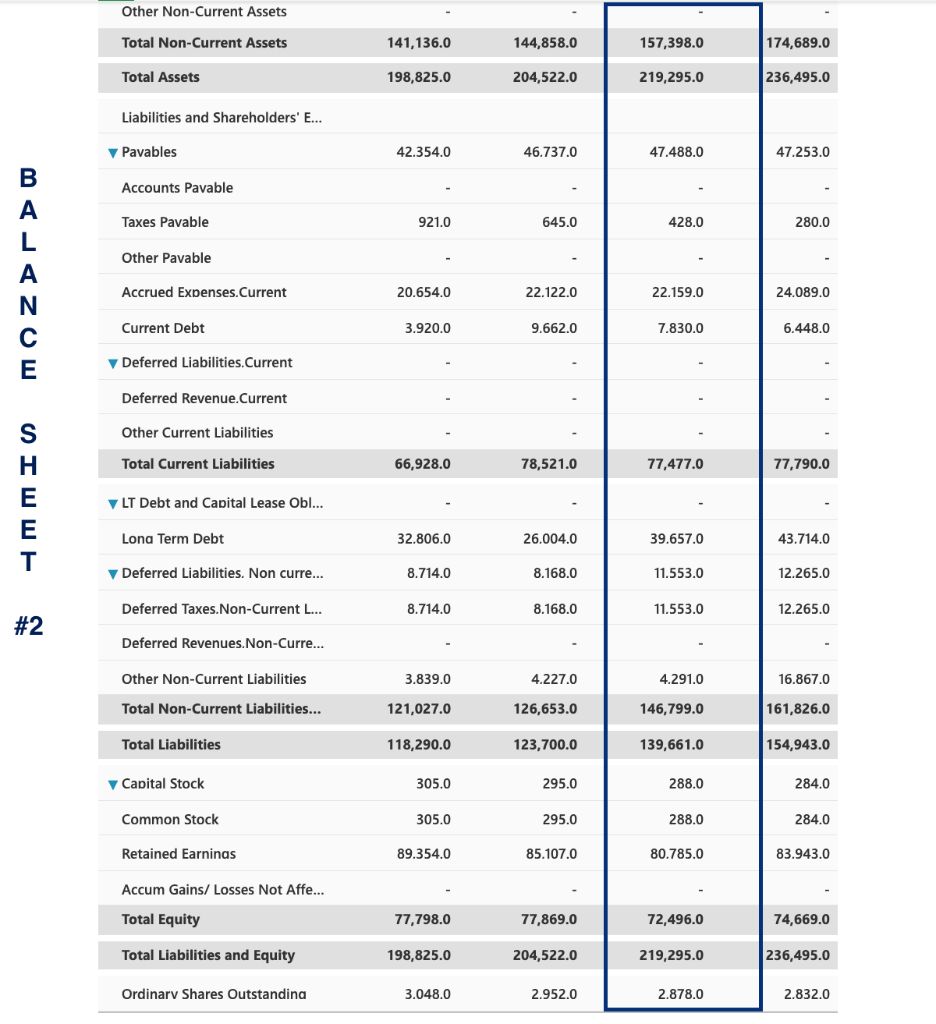
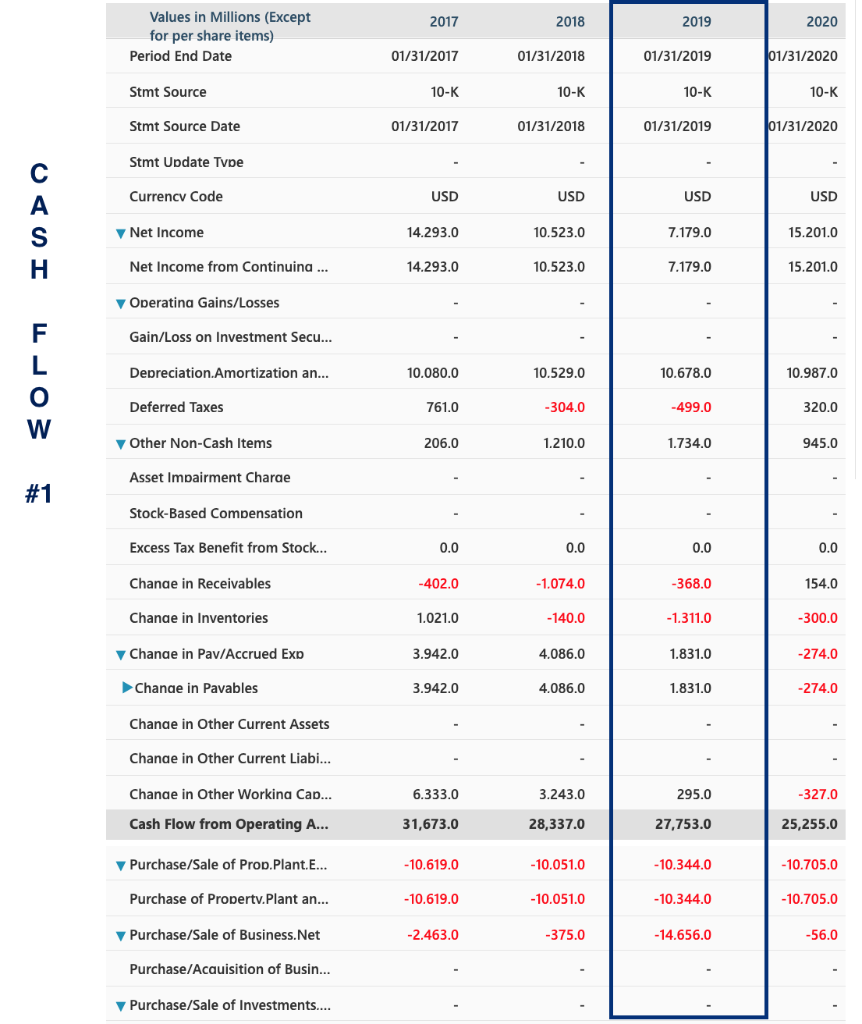
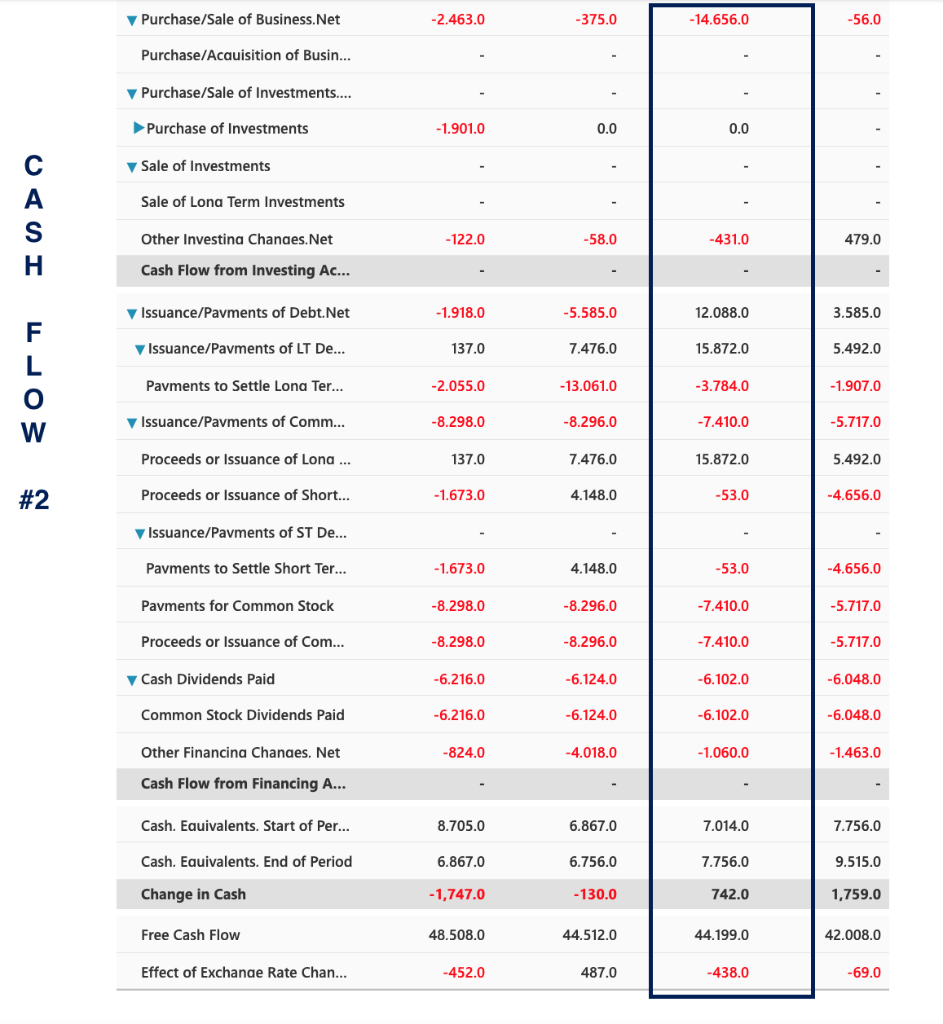
2017 2018 2019 2020 Values in Millions (Except for per share items) Period End Date 01/31/2017 01/31/2018 01/31/2019 01/31/2020 Stmt Source Annual Annual Annual Annual Stmt Source Date 01/31/2017 01/31/2018 01/31/2019 01/31/2020 Stmt Update Type Currency Code Total Revenue 485,873.0 500,343.0 514,405.0 523,964.0 Cost of Revenue 361.256.0 373.396.0 385.301.0 394.605.0 Gross Profit 124,617.0 126,947.0 129,104.0 129,359.0 ZUOEWEIE WEWZE Sellina. General and Administr... 101.853.0 106.510.0 107.147.0 108.791.0 General and Administrative E... 101.257.0 105.884.0 106.374.0 107.937.0 Selling and Marketing Expense 596.0 626.0 773.0 854.0 Research and Development Special Income/Charaes -3.136.0 -4.800.0 0.0 Operating Expenses 463, 109.0 483,042.0 497,248.0 503,396.0 Operating Income 22,764.0 17,301.0 17,157.0 20,568.0 Net Interest Income Other Income/Expense.Net Pre-Tax Income 20,497.0 15,123.0 11,460.0 20,116.0 Provision for Income Tax Net Income 13,643.0 9,862.0 6,670.0 14,881.0 Dividend Per Share 2.00 2.04 2.08 2.12 Tax Rate 30.2678 31.7397 33.4991 24.4333 Basic EPS 4.40 3.29 2.28 5.22 Basic Weighted Average Shares 3.101.00 2.995.00 2.929.00 2.850.00 Basic EPS from Continuina Op... 4.40 3.23 2.43 5.22 Basic EPS.Continuina and Disc... Diluted EPS 4.38 2.41 5.19 2017 2018 2019 2020 Values in Millions (Except for per share items) Period End Date 01/31/2017 01/31/2018 01/31/2019 01/31/2020 Stmt Source 10-K 10-K 10-K 10-K Stmt Source Date 01/31/2017 01/31/2018 01/31/2019 01/31/2020 Stmt Update Type Currency Code USD USD USD USD Assets Cash. Equiv and Short Term In... Cash and Cash Equivalents Short Term Investments Receivables 5.835.0 5.614.0 6.283.0 6.284.0 Accounts Receivable 5.835.0 5.614.0 6.283.0 6.284.0 MIJ ZOW IWWE Inventories 43.046.0 43.783.0 44.269.0 44.435.0 Finished Goods Raw Materials Work-in-Process Deferred Current Assets Deferred Taxes. Current Assets Other Current Assets Total Current Assets 57,689.0 59,664.0 61,897.0 61,806.0 #1 Net Property.Plant.and Equip... 114.178.0 114.818.0 111.395.0 127.049.0 Gross Property.plant and Ea... 191.129.0 197.857.0 198.570.0 216.869.0 Land and Improvements Buildinas and Improvements 98.547.0 101.155.0 101.006.0 105.674.0 Machinerv.Furniture/Equipm... 2.845.0 2.387.0 2.316.0 2.377.0 Leasehold and Improvements Accumulated Depreciation -76.951.0 -83.039.0 -87.175.0 -89.820.0 Goodwill and Other Intangibl... 17.037.0 18.242.0 31.181.0 31.073.0 Goodwill 17.037.0 18.242.0 31.181.0 31.073.0 Other Non-Current Assets Total Non-Current Assets 141,136.0 144,858.0 157,398.0 174,689.0 Total Assets 198,825.0 204,522.0 219,295.0 236,495.0 Liabilities and Shareholders' E... M Pavables 42.354.0 46.737.0 47.488.0 47.253.0 Accounts Pavable Taxes Pavable 921.0 645.0 428.0 280.0 Other Pavable Accrued Expenses.Current 20.654.0 22.122.0 22.159.0 24.089.0 zu Current Debt 3.920.0 9.662.0 7.830.0 6.448.0 Deferred Liabilities. Current Deferred Revenue.Current Other Current Liabilities Total Current Liabilities 66,928.0 78,521.0 77,477.0 77,790.0 LT Debt and Capital Lease Obl... IWWE. Lona Term Debt 32.806.0 26.004.0 39.657.0 43.714.0 Deferred Liabilities. Non curre... 8.714.0 8.168.0 11.553.0 12.265.0 Deferred Taxes. Non-Current L... 8.714.0 8.168.0 11.553.0 12.265.0 Deferred Revenues.Non-Curre... Other Non-Current Liabilities 3.839.0 4.227.0 4.291.0 16.867.0 Total Non-Current Liabilities... 121,027.0 126,653.0 146,799.0 161,826.0 Total Liabilities 118,290.0 123,700.0 139,661.0 154,943.0 Capital Stock 305.0 295.0 288.0 284.0 Common Stock 305.0 295.0 288.0 284.0 Retained Earnings 89.354.0 85.107.0 80.785.0 83.943.0 Accum Gains/Losses Not Affe... Total Equity 77,798.0 77,869.0 72,496.0 74,669.0 Total Liabilities and Equity 198,825.0 204,522.0 219,295.0 236,495.0 Ordinary Shares Outstanding 3.048.0 2.952.0 2.878.0 2.832.0 2017 2018 2019 2020 Values in Millions (Except for per share items) Period End Date 01/31/2017 01/31/2018 01/31/2019 01/31/2020 Stmt Source 10-K 10-K 10-K 10-K Stmt Source Date 01/31/2017 01/31/2018 01/31/2019 01/31/2020 Stmt Update Type Currency Code USD USD USD USD Net Income 14.293.0 10.523.0 7.179.0 15.2010 Net Income from Continuing ... 14.293.0 10.523.0 7.179.0 15.2010 Operatina Gains/Losses Gain/Loss on Investment Secu... Depreciation.Amortization an... 10.080.0 10.529.0 10.678.0 10.987.0 Deferred Taxes 761.0 -304.0 -499.0 320.0 Other Non-Cash Items 206.0 1.210.0 1.734.0 945.0 Asset Impairment Charae Stock-Based Compensation Excess Tax Benefit from Stock... 0.0 0.0 0.0 Change in Receivables -402.0 - 1.074.0 -368.0 154.0 Change in Inventories 1.021.0 - 140.0 -1.311.0 -300.0 Change in Pav/Accrued Exp 3.942.0 4.086.0 1.831.0 -274.0 Change in Pavables 3.942.0 4.086.0 1.831.0 -274.0 Change in Other Current Assets Change in Other Current Liabi... 6.333.0 3.243.0 295.0 -327.0 Change in Other Working Cap... Cash Flow from Operating A... 31,673.0 28,337.0 27,753.0 25,255.0 Purchase/Sale of Prop.Plant.E... -10.619.0 -10.051.0 -10.344.0 -10.705.0 Purchase of Property.Plant an... -10.619.0 -10.051.0 -10.344.0 -10.705.0 Purchase/Sale of Business.Net -2.463.0 -375.0 -14.656.0 -56.0 Purchase/Acauisition of Busin... Purchase/Sale of Investments.... Purchase/Sale of Business.Net -2.463.0 -375.0 -14.656.0 -56.0 Purchase/Acauisition of Busin... Purchase/Sale of Investments.... Purchase of Investments -1.901.0 Sale of Investments Sale of Lona Term Investments Other Investina Changes.Net -122.0 -58.0 -431.0 479.0 Cash Flow from Investing Ac... Issuance/Payments of Debt.Net -1.918.0 -5.585.0 12.088.0 3.585.0 # Eorn IUDO Issuance/Payments of LT De... 137.0 7.476.0 15.872.0 5.492.0 Payments to Settle Lona Ter... -2.055.0 -13.061.0 -3.784.0 -1.907.0 Issuance/Payments of Comm... -8.298.0 -8.296.0 -7.410.0 -5.717.0 Proceeds or Issuance of Lona ... 137.0 7.476.0 15.872.0 5.492.0 Proceeds or Issuance of Short... -1.673.0 4.148.0 -53.0 -4.656.0 Issuance/Pavments of ST De... Pavments to Settle Short Ter... -1.673.0 4.148.0 -53.0 -4.656.0 Payments for Common Stock -8.298.0 -8.296.0 -7.410.0 -5.717.0 Proceeds or Issuance of Com... -8.298.0 -8.296.0 -7.410.0 -5.717.0 Cash Dividends Paid -6.216.0 -6.124.0 -6.102.0 -6.048.0 Common Stock Dividends Paid -6.216.0 -6.124.0 -6.102.0 -6.048.0 -824.0 -4.018.0 -1.060.0 -1.463.0 Other Financina Changes. Net Cash Flow from Financing A... Cash. Equivalents. Start of Per... 8.705.0 6.867.0 7.014.0 7.756.0 Cash. Eauivalents. End of Period 6.867.0 6.756.0 7.756.0 9.515.0 Change in Cash - 1,747.0 - 130.0 742.0 1,759.0 Free Cash Flow 48.508.0 44.512.0 44.199.0 42.008.0 Effect of Exchange Rate Chan... -452.0 487.0 -438.0 -69.0