Please complete the following: (data has already been collected) The Pendulum Observations: Changing Amplitude (Procedure #2) Table 1 Time for 20 cycles Length Amplitude Average
Please complete the following:
(data has already been collected)
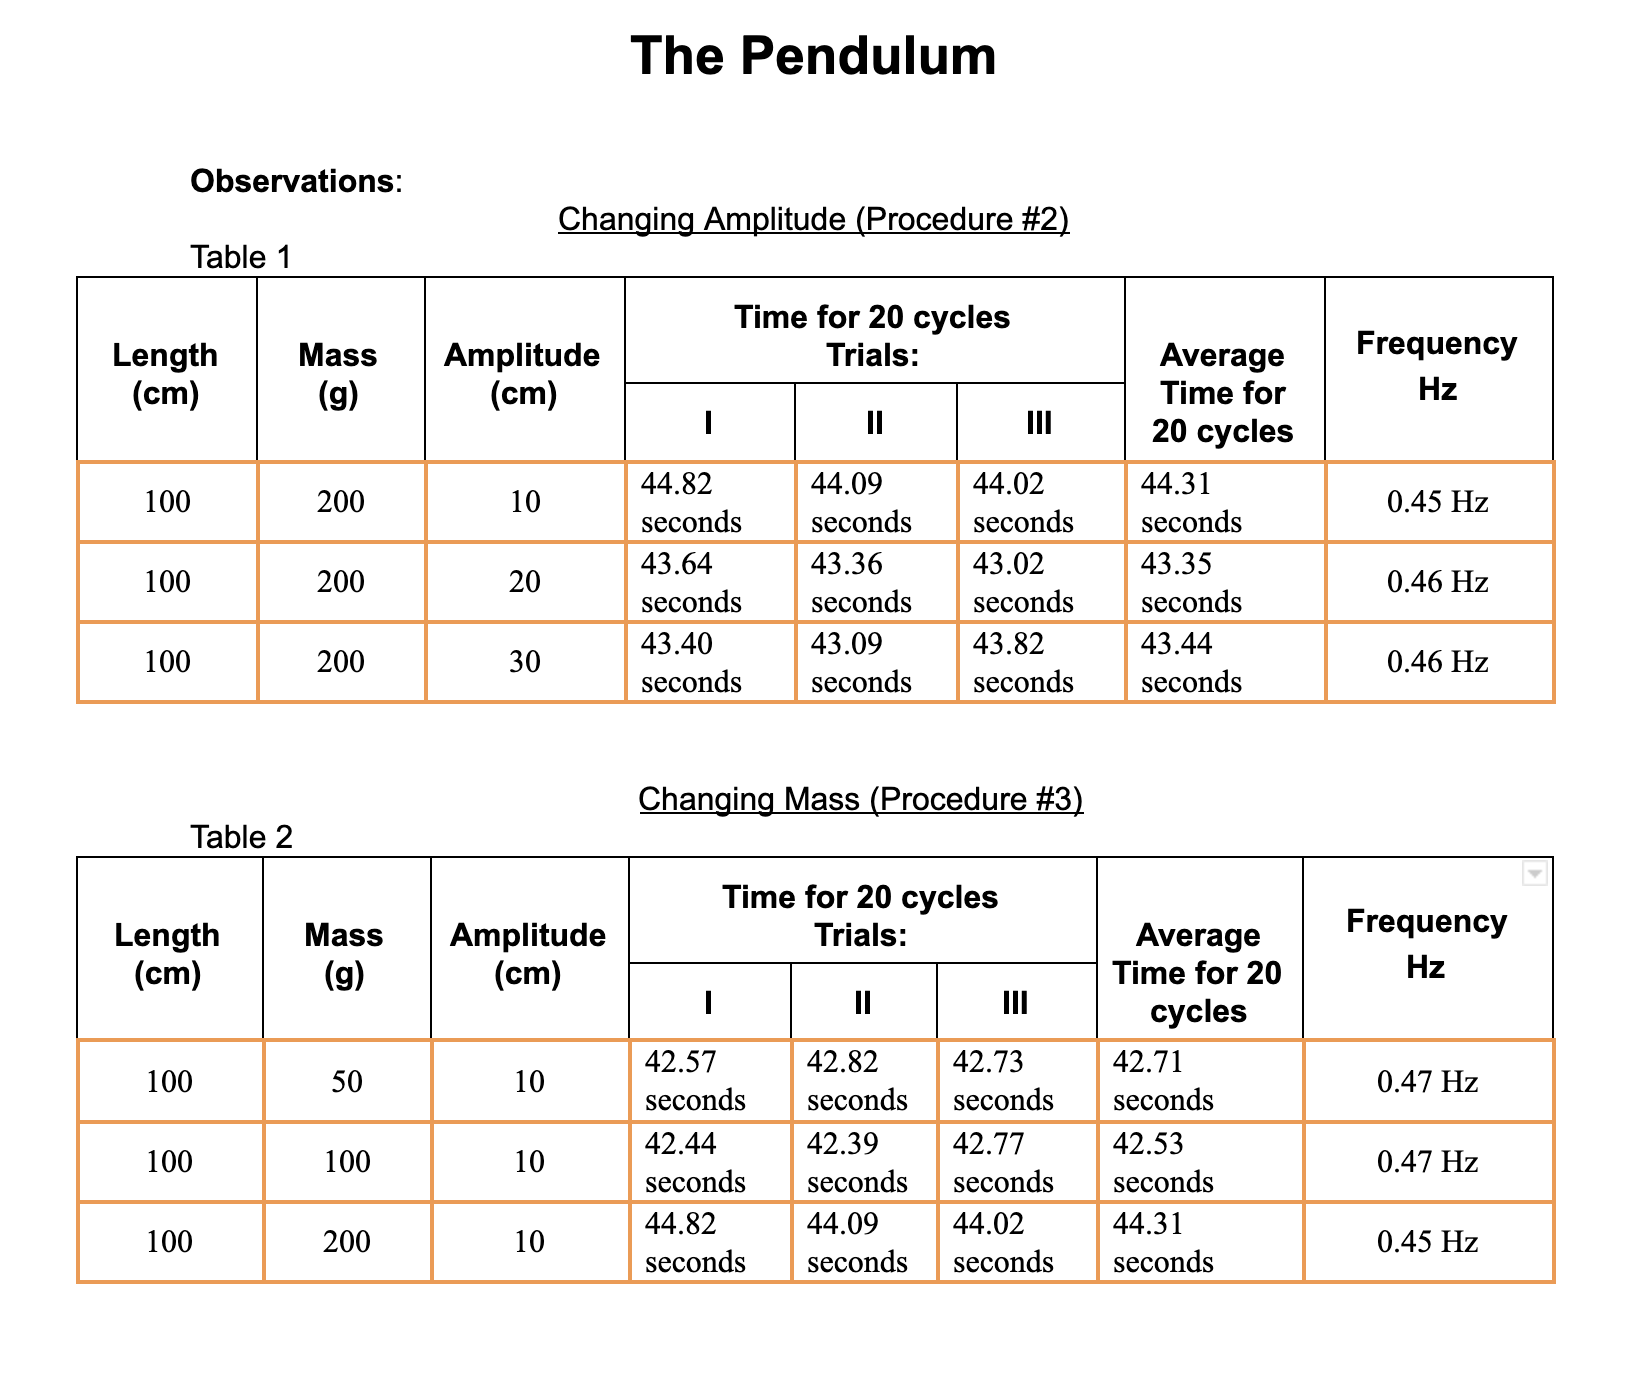
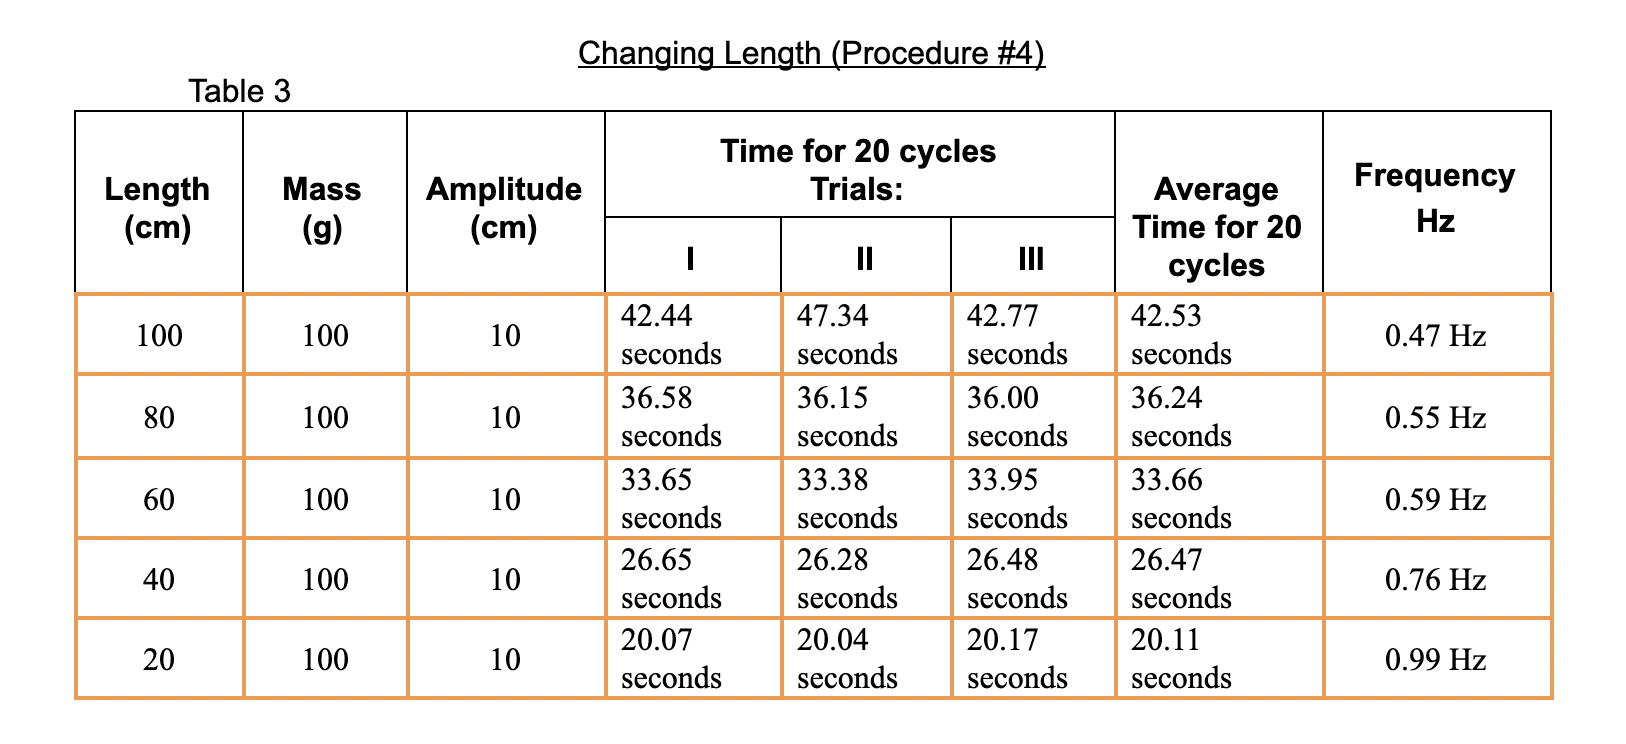
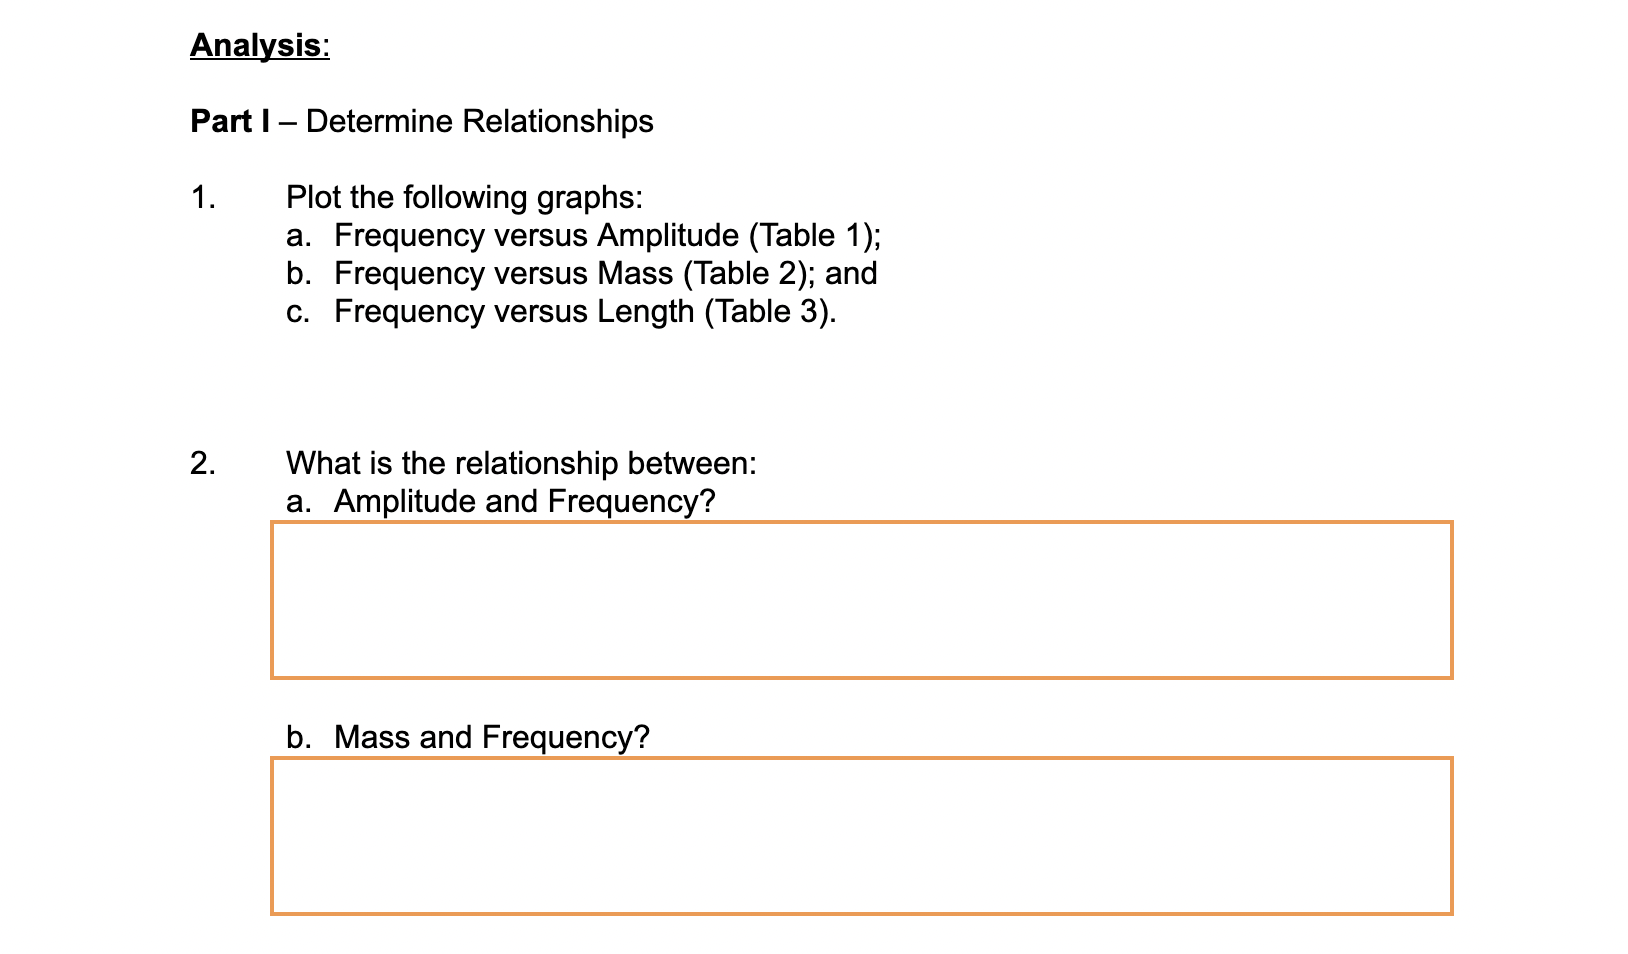
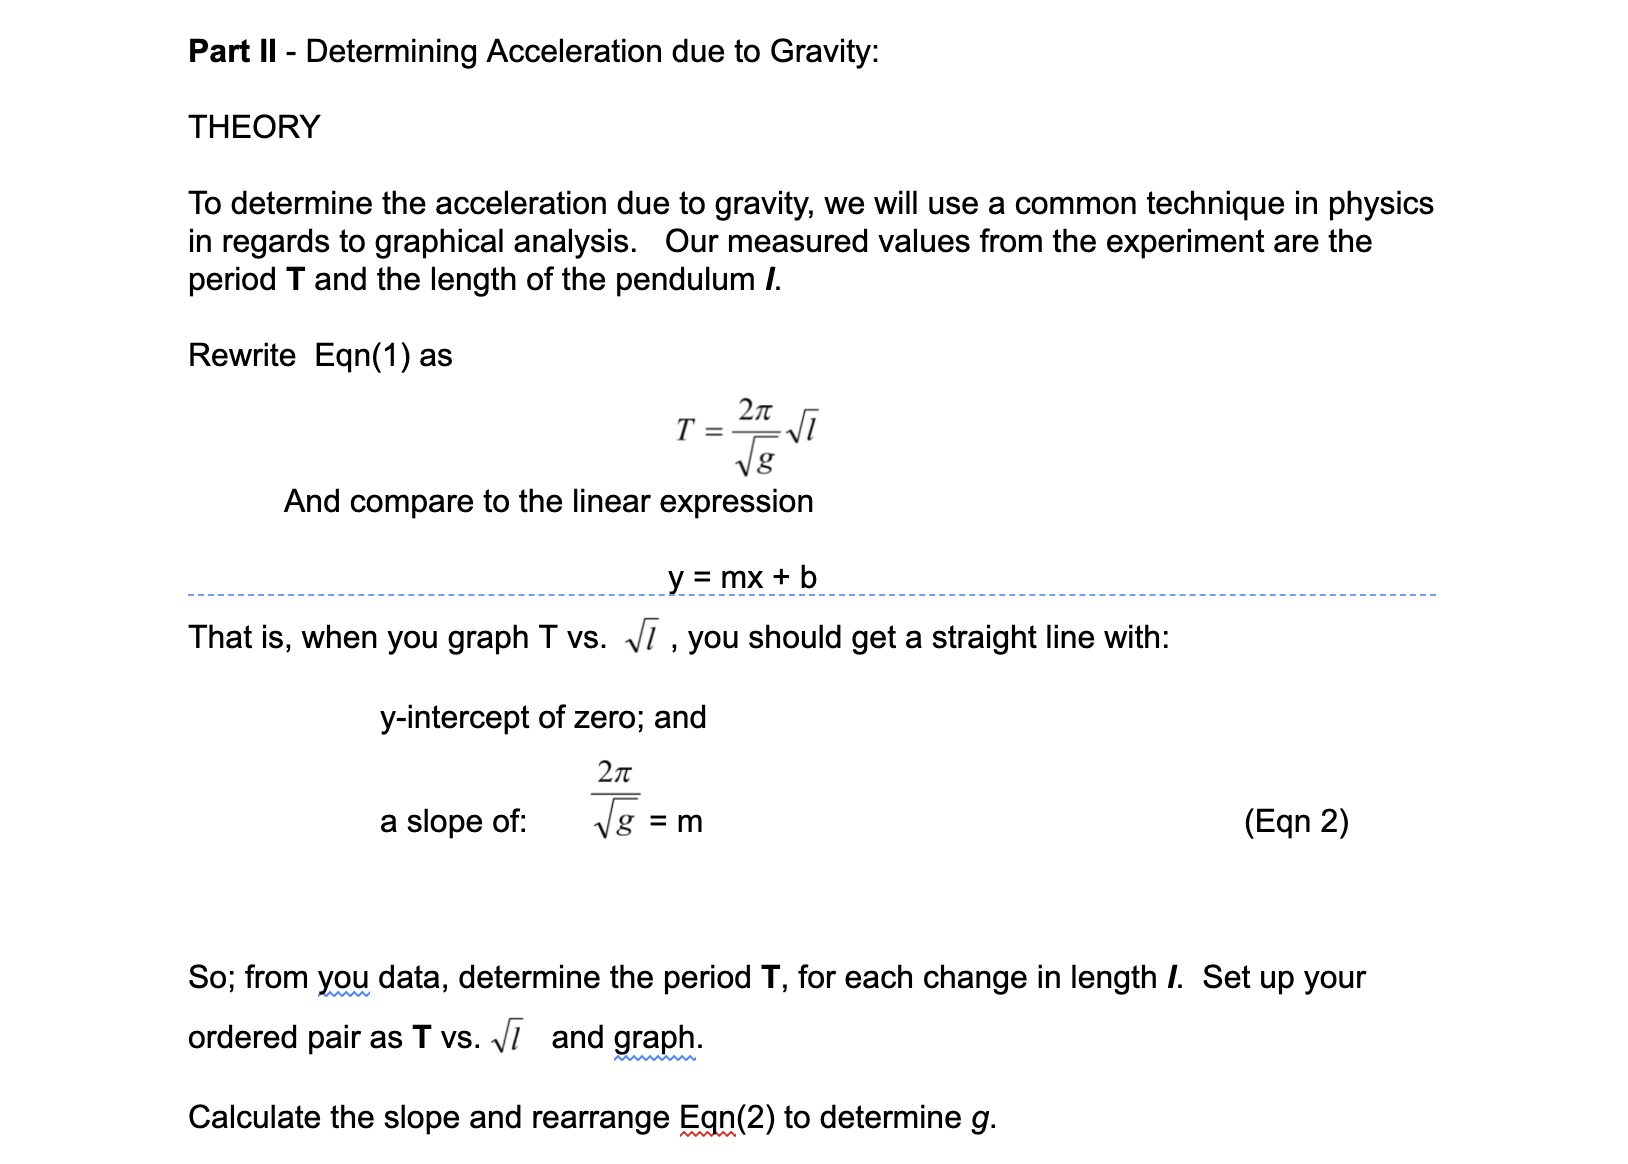
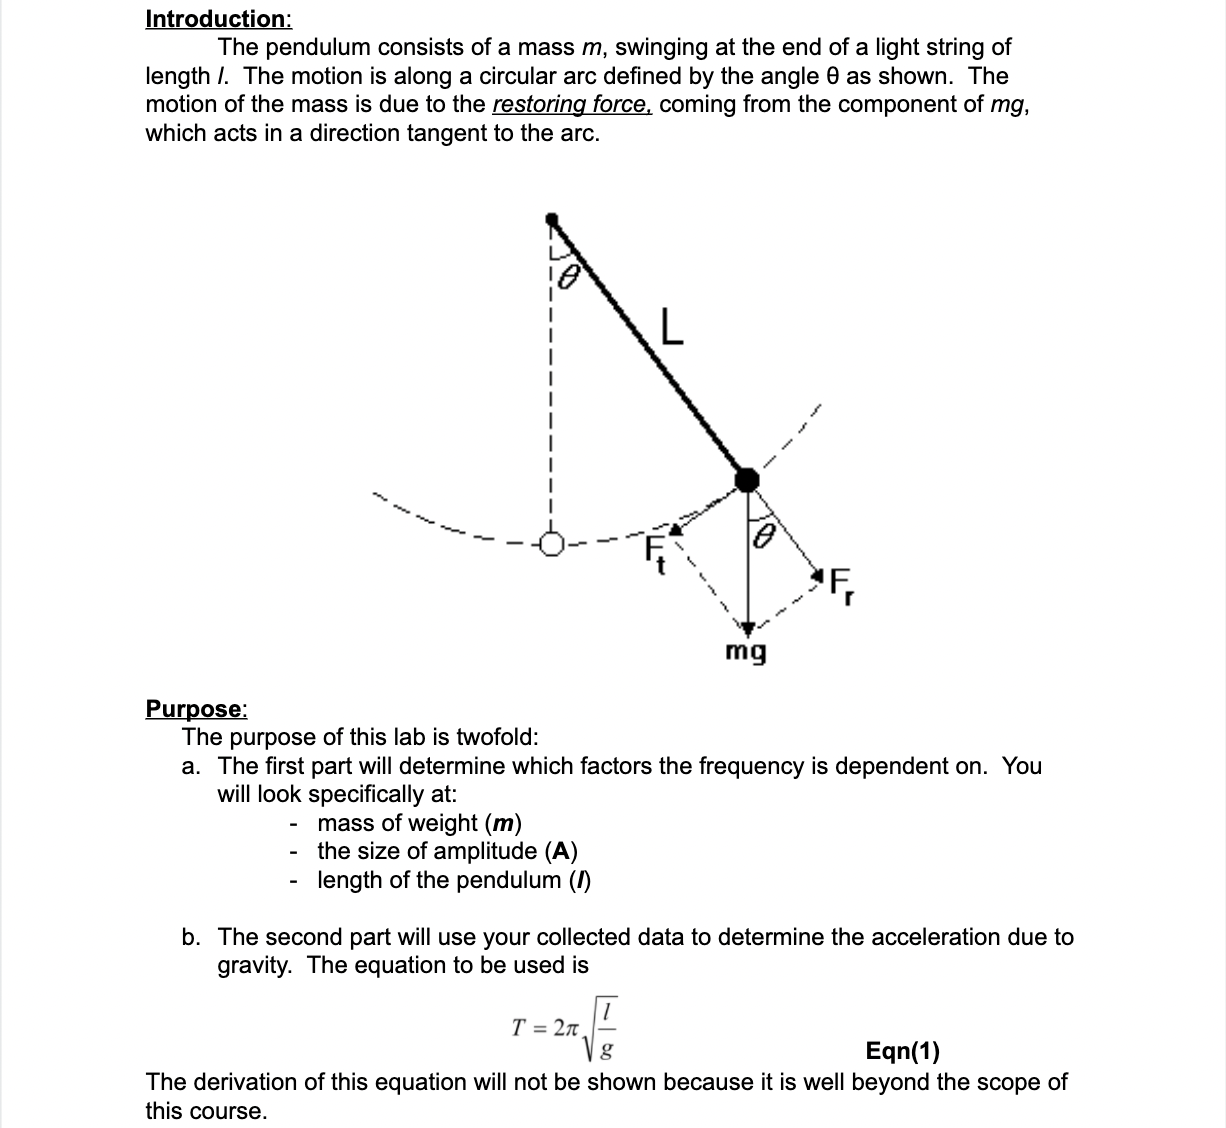
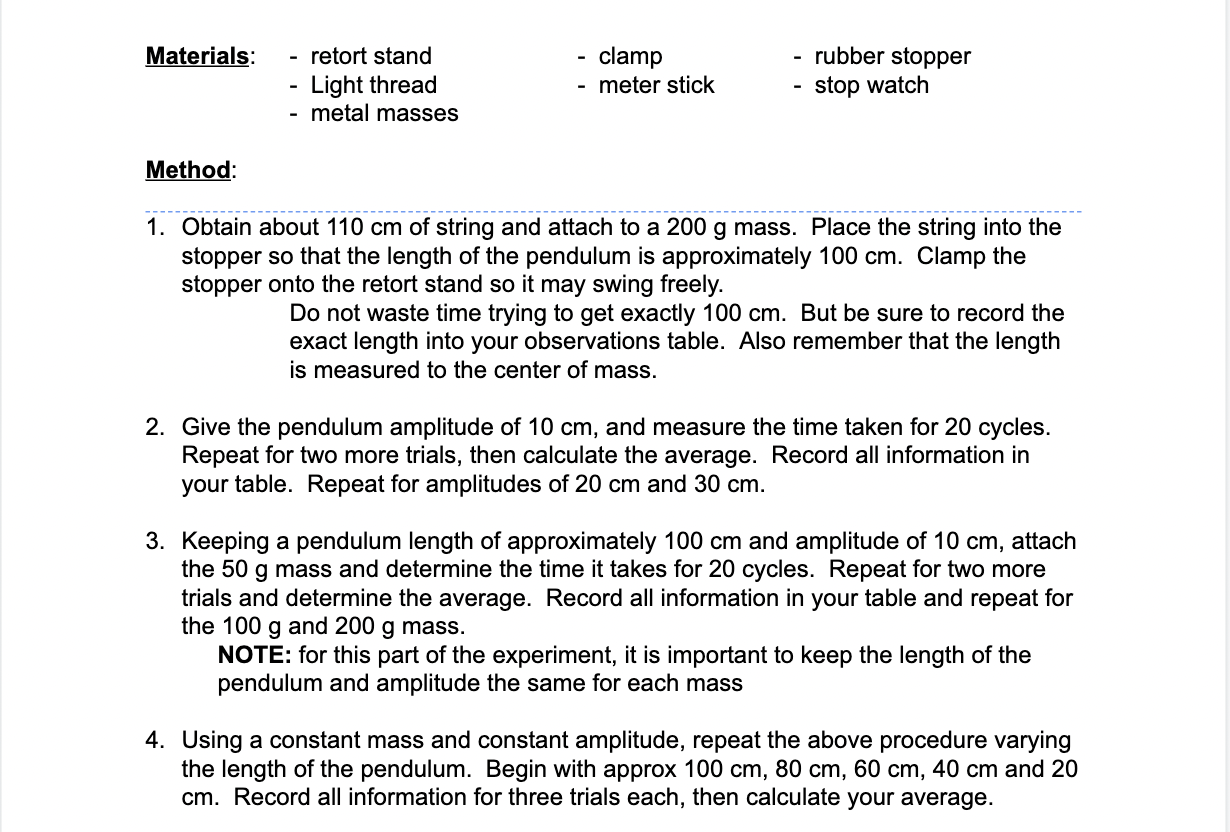
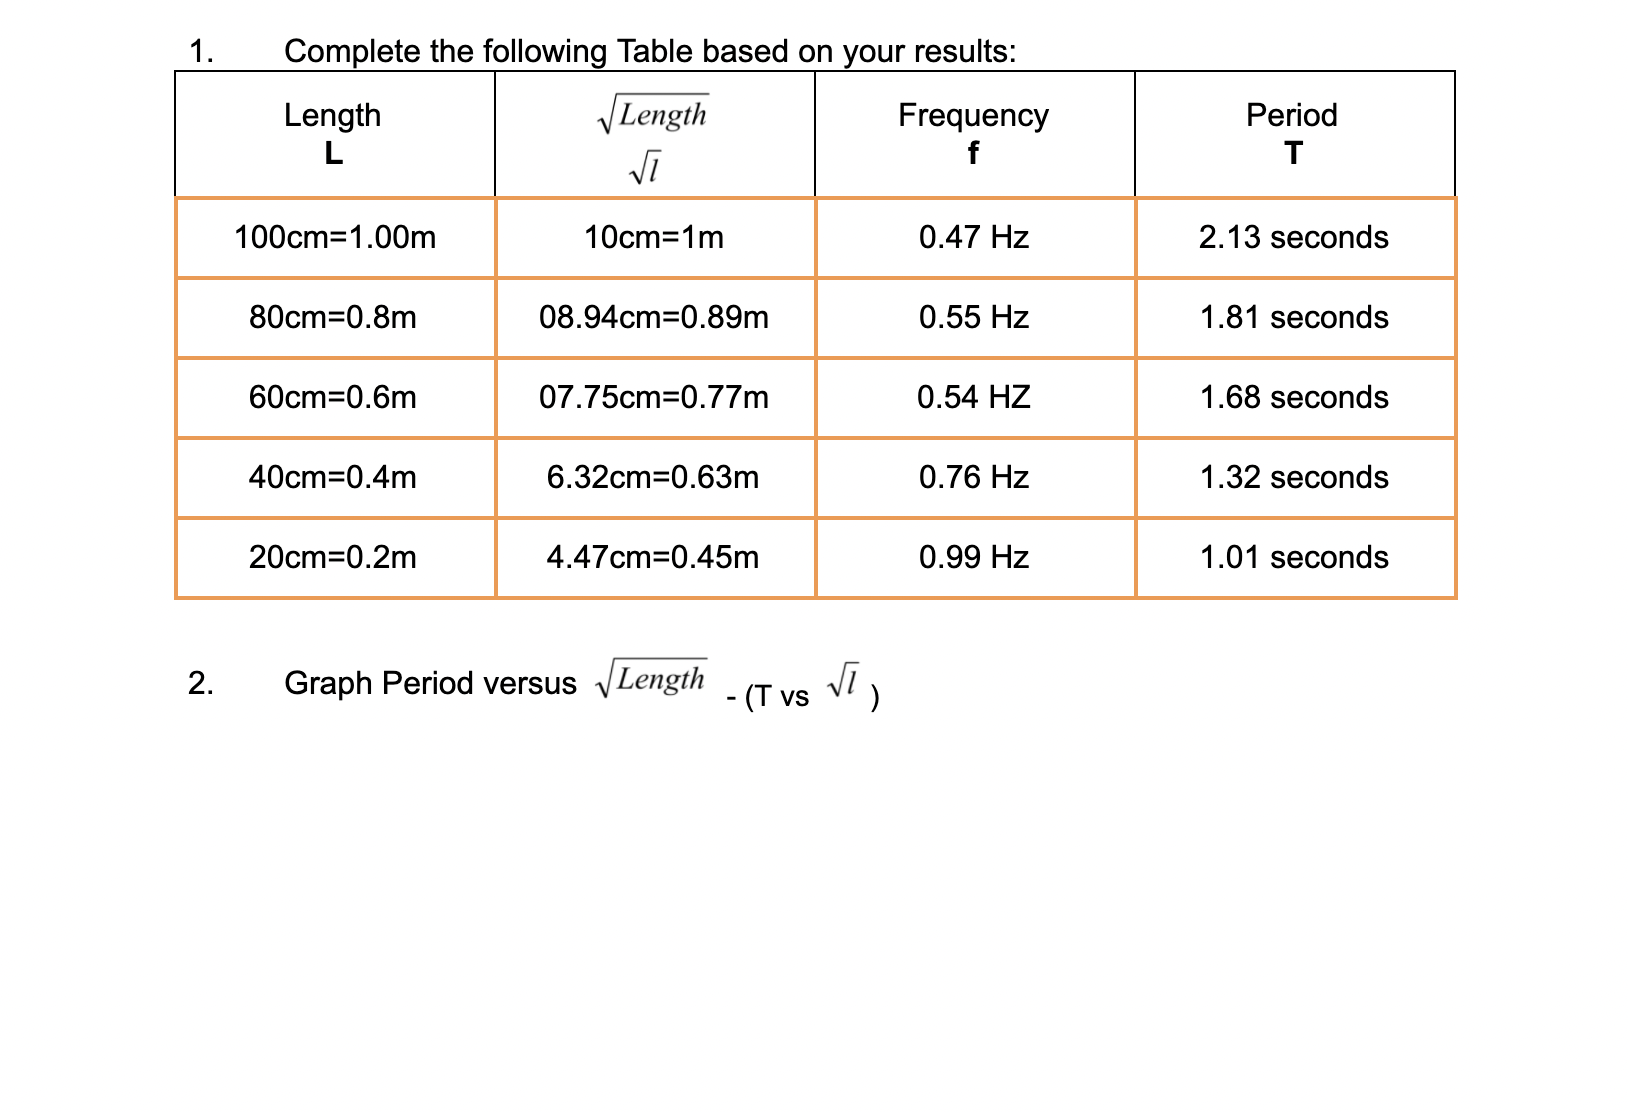
The Pendulum Observations: Changing Amplitude (Procedure #2) Table 1 Time for 20 cycles Length Amplitude Average Frequency (cm) (cm) Time for H2 100 200 10 44.82 44.09 44.02 44.31 0.45 Hz seconds seconds seconds seconds 100 200 20 43.64 43.36 43.02 43.35 0.46 Hz seconds seconds seconds seconds 100 200 30 43.40 43.09 43.82 43.44 0.46 Hz seconds seconds seconds seconds Changing Mass (Procedure #3) Table 2 Time for 20 cycles Length Amplitude Trials: Average (cm) (cm) Time for 20 100 50 10 42.57 42.82 42.73 42.71 0.47 Hz seconds seconds seconds seconds 100 100 10 42.44 42.39 42.77 42.53 0.47 HZ seconds seconds seconds seconds 100 200 10 44.82 44.09 44.02 44.31 0.45 Hz seconds seconds seconds seconds Changing Length (Procedure #4) Table 3 Time for 20 cycles Length Amplitude Trials: ''"' '"" II 100 100 10 42.44 47 34 42.77 seconds seconds seconds 100 10 36.58 36.15 36.00 seconds seconds seconds 100 10 33.65 33.38 33.95 seconds seconds seconds 100 10 26.65 26.28 26.48 seconds seconds seconds 20 100 10 20.07 20.04 20.17 seconds seconds seconds Average Time for 20 cycles 42.53 seconds 36.24 seconds 33 .66 seconds 26.47 seconds 20. 1 1 seconds Analysis: Part I Determine Relationships 1. Plot the following graphs: a. Frequency versus Amplitude (Table 1); b. Frequency versus Mass (Table 2); and 0. Frequency versus Length (Table 3). 2. What is the relationship between: a. Amplitude and Frequency? b. Mass and Frequency? \fPart II - Determining Acceleration due to Gravity: THEORY To determine the acceleration due to gravity, we will use a common technique in physics in regards to graphical analysis. Our measured values from the experiment are the period T and the length of the pendulum I. Rewrite Eqn(1) as T=2\" g f And compare to the linear expression ________________________________________________ y=mx+b That is, when you graph T vs. J? , you should get a straight line with: y-intercept of zero; and 2_rr a slope of: J; = m (Eqn 2) So; from ygg data. determine the period T, for each change in length I. Set up your ordered pair as T vs. and graph. Calculate the slope and rearrange [351119) to determine 9. Introduction: The pendulum consists of a mass m, swinging at the end of a light string of length /. The motion is along a circular arc defined by the angle 0 as shown. The motion of the mass is due to the restoring force, coming from the component of mg, which acts in a direction tangent to the arc. mg Purpose: The purpose of this lab is twofold: a. The first part will determine which factors the frequency is dependent on. You will look specifically at: mass of weight (m) the size of amplitude (A) length of the pendulum (!) b. The second part will use your collected data to determine the acceleration due to gravity. The equation to be used is T = 2n g Eqn(1) The derivation of this equation will not be shown because it is well beyond the scope of this course.Materials: - retort stand - clamp - rubber stopper - Light thread - meter stick - stop watch - metal masses 1. Obtain about 110 cm of string and attach to a 200 9 mass. Place the string into the stopper so that the length of the pendulum is approximately 100 cm. Clamp the stopper onto the retort stand so it may swing freely. Do not waste time trying to get exactly 100 cm. But be sure to record the exact length into your observations table. Also remember that the length is measured to the center of mass. 2. Give the pendulum amplitude of 10 cm. and measure the time taken for 20 cycles. Repeat for two more trials, then calculate the average. Record all information in your table. Repeat for amplitudes of 20 cm and 30 cm. 3. Keeping a pendulum length of approximately 100 cm and amplitude of 10 cm. attach the 50 g mass and determine the time it takes for 20 cycles. Repeat for two more trials and determine the average. Record all information in your table and repeat for the 100 g and 200 9 mass. NOTE: for this part of the experiment, it is important to keep the length of the pendulum and amplitude the same for each mass 4. Using a constant mass and constant amplitude, repeat the above procedure varying the length of the pendulum. Begin with approx 100 cm, 80 cm, 60 cm, 40 cm and 20 cm. Record all information for three trials each, then calculate your average. Complete the following Table based on your results: Length Length Frequency Period L Vi f T 100cm=1.00m 10cm=1m 0.47 Hz 2.13 seconds 80cm=0.8m 08.94cm=0.89m 0.55 Hz 1.81 seconds 60cm=0.6m 07.75cm=0.77m 0.54 HZ 1.68 seconds 40cm=0.4m 6.32cm=0.63m 0.76 Hz 1.32 seconds 20cm=0.2m 4.47cm=0.45m 0.99 Hz 1.01 seconds 2. Graph Period versus vLength - ( Tvs VI )3. What is the Slope of your line of best fit.4. 5. Use Eqn 2 and calculate the acceleration due to Gravity constant g' . Determine the percent error in your solution. high value - low value %error = x 100% average value
Step by Step Solution
There are 3 Steps involved in it
Step: 1
Get Instant Access to Expert-Tailored Solutions
See step-by-step solutions with expert insights and AI powered tools for academic success
Step: 2
Step: 3
Ace Your Homework with AI
Get the answers you need in no time with our AI-driven, step-by-step assistance