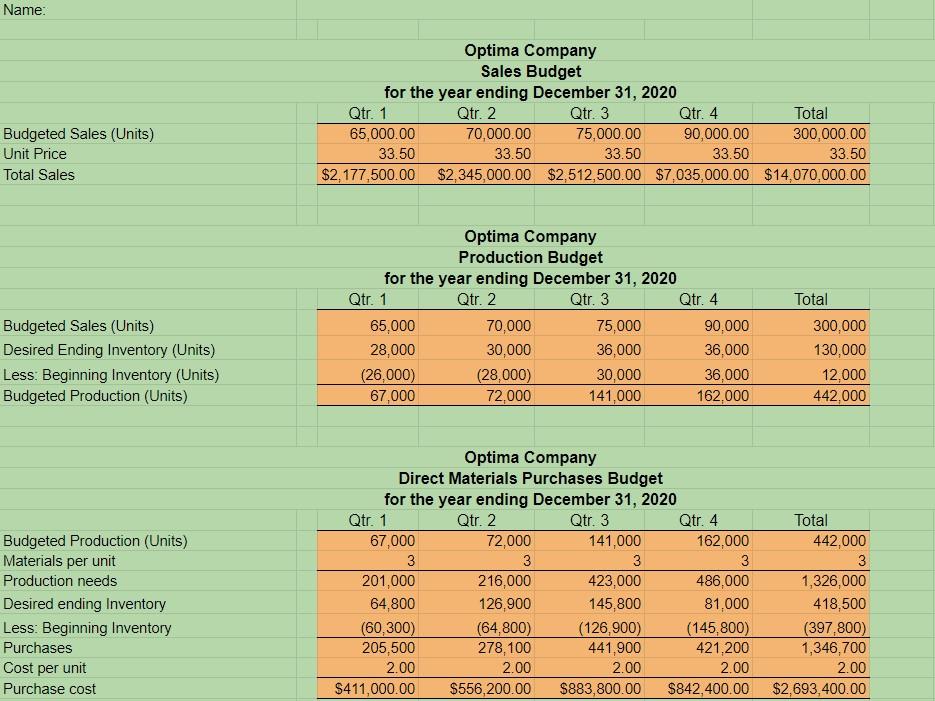
Please complete the Orange Blank Spaces with the information from the graph.
 Thank You
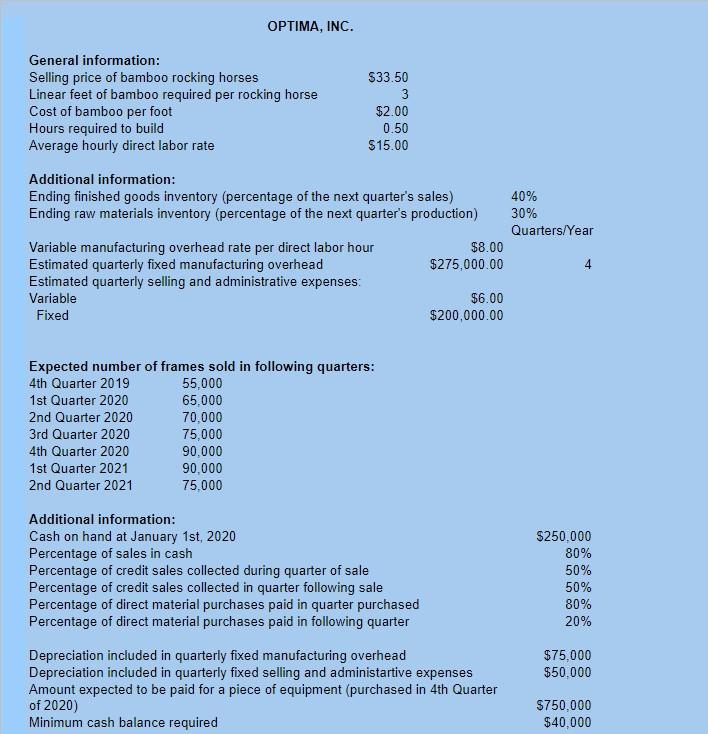
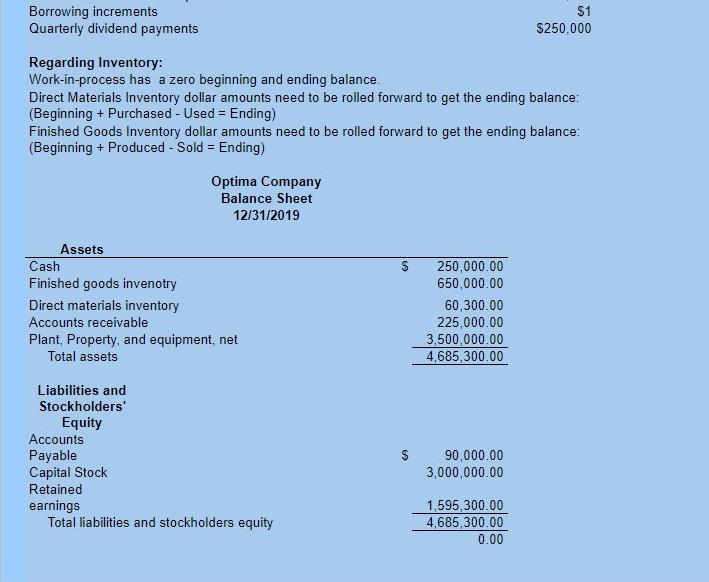
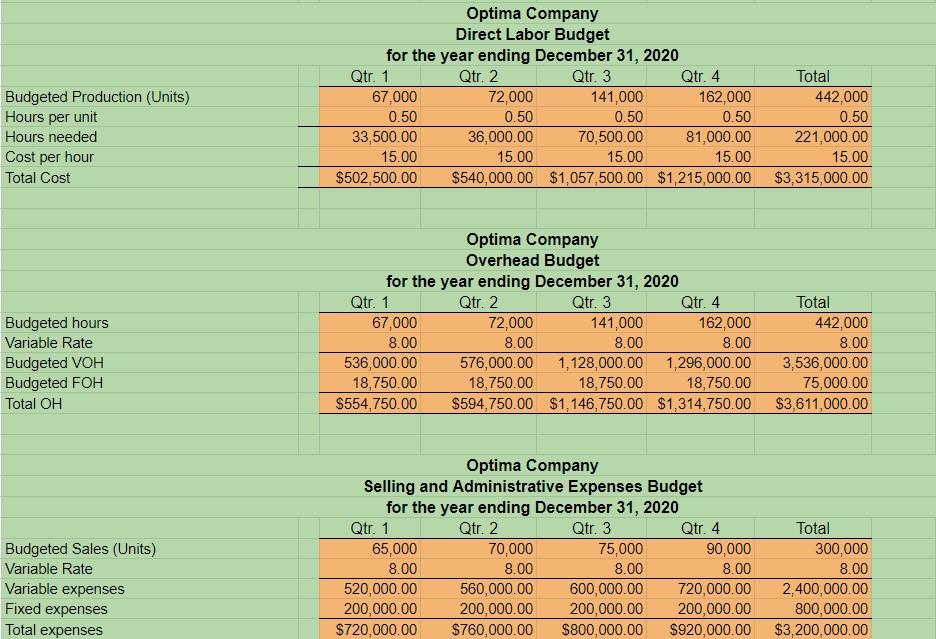
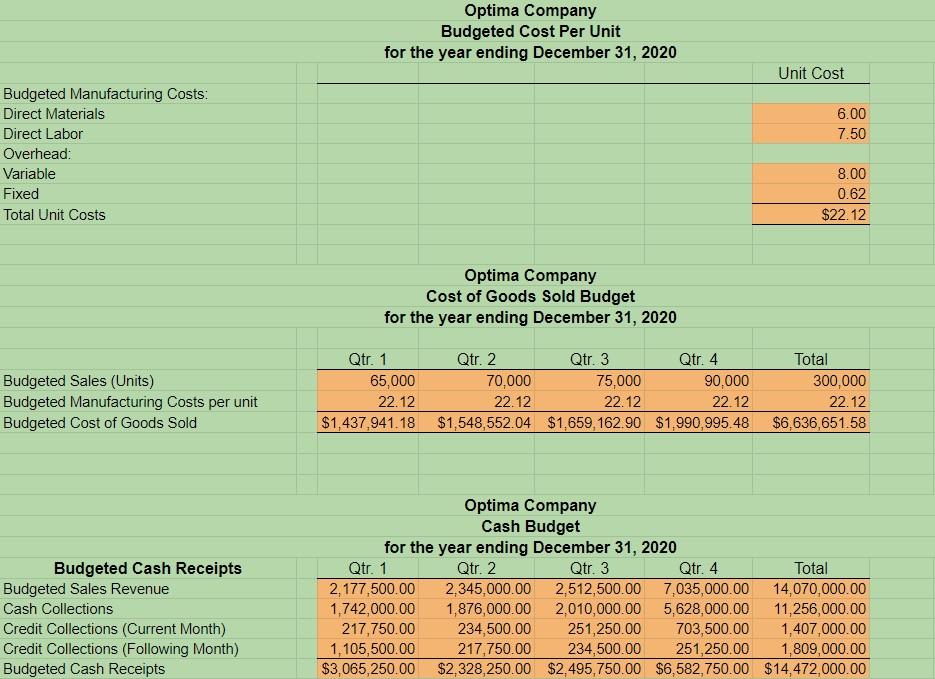
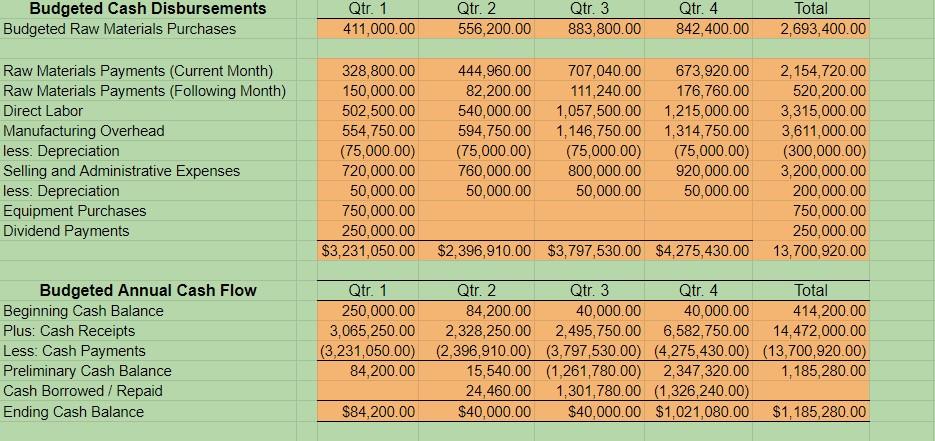
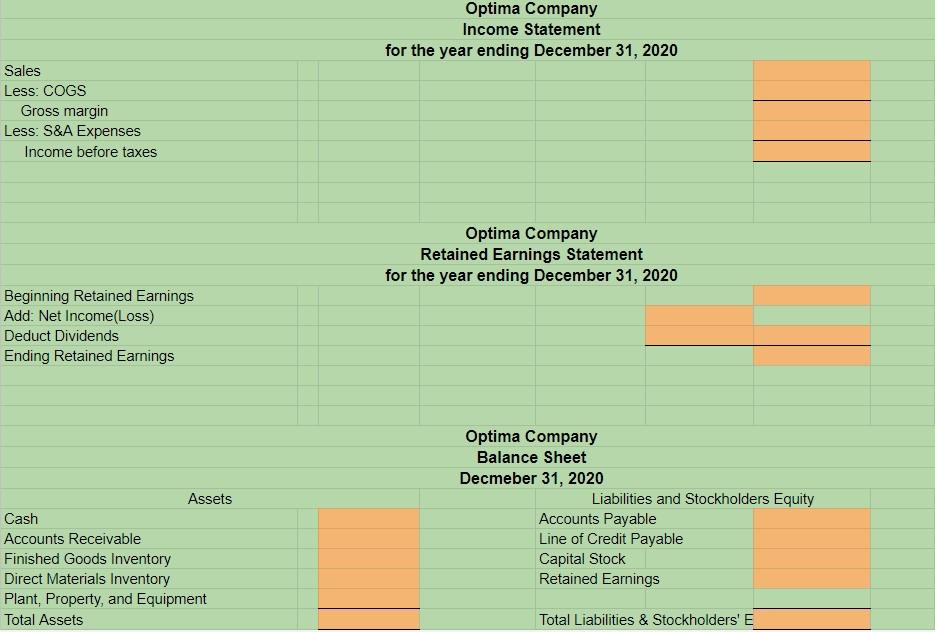
OPTIMA, INC. Additional information: Ending finished goods inventory (percentage of the next quarter's sales) Ending raw materials inventory (percentage of the next quarter's production) Expected number of frames sold in following quarters: Borrowing increments Quarterly dividend payments $1 $250,000 Regarding Inventory: Work-in-process has a zero beginning and ending balance. Direct Materials Inventory dollar amounts need to be rolled forward to get the ending balance: (Beginning + Purchased - Used = Ending) Finished Goods Inventory dollar amounts need to be rolled forward to get the ending balance: (Beginning + Produced Sold = Ending) Name: Optima Company Sales Budget for the year ending December 31, 2020 Budgeted Sales (Units) Unit Price Total Sales \begin{tabular}{rrrrr} \multicolumn{1}{c}{ Qtr. 1 } & Qtr. 2 & Qtr. 3 & Qtr. 4 & \multicolumn{1}{l}{ Total } \\ \hline 65,000.00 & 70,000.00 & 75,000.00 & 90,000.00 & 300,000.00 \\ 33.50 & 33.50 & 33.50 & 33.50 & 33.50 \\ \hline$2,177,500.00 & $2,345,000.00 & $2,512,500.00 & $7,035,000.00 & $14,070,000.00 \\ \hline \end{tabular} Optima Company Production Budget for the year ending December 31, 2020 Budgeted Sales (Units) Desired Ending Inventory (Units) Less: Beginning Inventory (Units) Budgeted Production (Units) \begin{tabular}{rrrrrr} \multicolumn{1}{c|}{ Qtr. 1 } & Qtr. 2 & Qtr. 3 & \multicolumn{1}{c|}{ Qtr. 4 } & \multicolumn{1}{c|}{ Total } \\ \hline 65,000 & 70,000 & 75,000 & 90,000 & 300,000 \\ \hline 28,000 & 30,000 & 36,000 & 36,000 & 130,000 \\ \hline(26,000) & (28,000) & 30,000 & 36,000 & 12,000 \\ \hline 67,000 & 72,000 & 141,000 & 162,000 & 442,000 \\ \hline \end{tabular} Optima Company Direct Materials Purchases Budget for the year ending December 31, 2020 Budgeted Production (Units) Materials per unit Production needs Desired ending Inventory Less: Beginning Inventory Purchases Cost per unit Purchase cost \begin{tabular}{rrrrrr} \multicolumn{1}{c}{ Qtr. 1} & Qtr. 2 & Qtr. 3 & Qtr. 4 & \multicolumn{1}{l}{ Total } \\ \hline 67,000 & 72,000 & 141,000 & 162,000 & 442,000 \\ \hline 3 & 3 & 3 & 3 & 3 \\ \hline 201,000 & 216,000 & 423,000 & 486,000 & 1,326,000 \\ 64,800 & 126,900 & 145,800 & 81,000 & 418,500 \\ (60,300) & (64,800) & (126,900) & (145,800) & (397,800) \\ \hline 205,500 & 278,100 & 441,900 & 421,200 & 1,346,700 \\ \hline 2.00 & 2.00 & 2.00 & 2.00 & 2.00 \\ \hline$411,000.00 & $556,200.00 & $883,800.00 & $842,400.00 & $2,693,400.00 \\ \hline \end{tabular} Optima Company Direct Labor Budget for the year ending December 31, 2020 Optima Company Overhead Budget for the year ending December 31,2020 Budgeted hours Variable Rate Budgeted VOH Budgeted FOH Total OH \begin{tabular}{rrrrr|} \multicolumn{1}{c}{ Qtr. 1 } & Qtr. 2 & Qtr. 3 & \multicolumn{1}{c|}{ Qtr. 4 } & \multicolumn{1}{l}{ Total } \\ \hline 67,000 & 72,000 & 141,000 & 162,000 & 442,000 \\ 8.00 & 8.00 & 8.00 & 8.00 & 8.00 \\ \hline 536,000.00 & 576,000.00 & 1,128,000.00 & 1,296,000.00 & 3,536,000.00 \\ 18,750.00 & 18,750.00 & 18,750.00 & 18,750.00 & 75,000.00 \\ \hline$554,750.00 & $594,750.00 & $1,146,750.00 & $1,314,750.00 & $3,611,000.00 \\ \hline \end{tabular} Optima Company Selling and Administrative Expenses Budget for the year ending December 31,2020 Budgeted Sales (Units) Variable Rate Variable expenses Fixed expenses Total expenses \begin{tabular}{rrrrr} \multicolumn{1}{c}{ Qtr. 1 } & Qtr. 2 & Qtr. 3 & Qtr. 4 & \multicolumn{1}{l}{ Total } \\ \hline 65,000 & 70,000 & 75,000 & 90,000 & 300,000 \\ 8.00 & 8.00 & 8.00 & 8.00 & 8.00 \\ \hline 520,000.00 & 560,000.00 & 600,000.00 & 720,000.00 & 2,400,000.00 \\ 200,000.00 & 200,000.00 & 200,000.00 & 200,000.00 & 800,000.00 \\ \hline$720,000.00 & $760,000.00 & $800,000.00 & $920,000.00 & $3,200,000.00 \end{tabular} Optima Company Budgeted Cost Per Unit for the year ending December 31, 2020 Budgeted Manufacturing Costs: Direct Materials Direct Labor Overhead: Variable Fixed Total Unit Costs Unit Cost Optima Company Cost of Goods Sold Budget for the year ending December 31,2020 Budgeted Sales (Units) Budgeted Manufacturing Costs per unit Budgeted Cost of Goods Sold \begin{tabular}{rrrrrr} \multicolumn{1}{c|}{ Qtr. 1 } & Qtr. 2 & Qtr. 3 & Qtr. 4 & \multicolumn{1}{l|}{ Total } \\ \hline 65,000 & 70,000 & 75,000 & 90,000 & 300,000 \\ 22.12 & 22.12 & 22.12 & 22.12 & 22.12 \\ \hline$1,437,941.18 & $1,548,552.04 & $1,659,162.90 & $1,990,995.48 & $6,636,651.58 \\ \hline \end{tabular} Optima Company Cash Budget for the year ending December 31, 2020 \begin{tabular}{lrrrrrr} \multicolumn{1}{c}{ Budgeted Cash Receipts } & \multicolumn{1}{c}{ Qtr. 1 } & \multicolumn{1}{c|}{ Qtr. 2 } & Qtr. 3 & Qtr. 4 & Total \\ \cline { 2 - 6 } & 2,177,500.00 & 2,345,000.00 & 2,512,500.00 & 7,035,000.00 & 14,070,000.00 \\ Budgeted Sales Revenue & 1,742,000.00 & 1,876,000.00 & 2,010,000.00 & 5,628,000.00 & 11,256,000.00 \\ Cash Collections & 217,750.00 & 234,500.00 & 251,250.00 & 703,500.00 & 1,407,000.00 \\ Credit Collections (Current Month) & 1,105,500.00 & 217,750.00 & 234,500.00 & 251,250.00 & 1,809,000.00 \\ \hline Credit Collections (Following Month) & $3,065,250.00 & $2,328,250.00 & $2,495,750.00 & $6,582,750.00 & $14,472,000.00 \end{tabular} Optima Company Income Statement for the year ending December 31,2020 Sales Less: COGS Gross margin Less: S\&A Expenses Income before taxes Optima Company Retained Earnings Statement for the year ending December 31, 2020 Beginning Retained Earnings Add: Net Income(Loss) Deduct Dividends Ending Retained Earnings Optima Company Balance Sheet Decmeber 31, 2020 Assets Liabilities and Stockholders Equity Cash Accounts Payable Accounts Receivable Line of Credit Payable Finished Goods Inventory Capital Stock Direct Materials Inventory Retained Earnings Plant, Property, and Equipment Total Assets Total Liabilities \& Stockholders' E