Please complete with how to perform calculations in Excel. Not time sensitive. This is all the information given for this question.
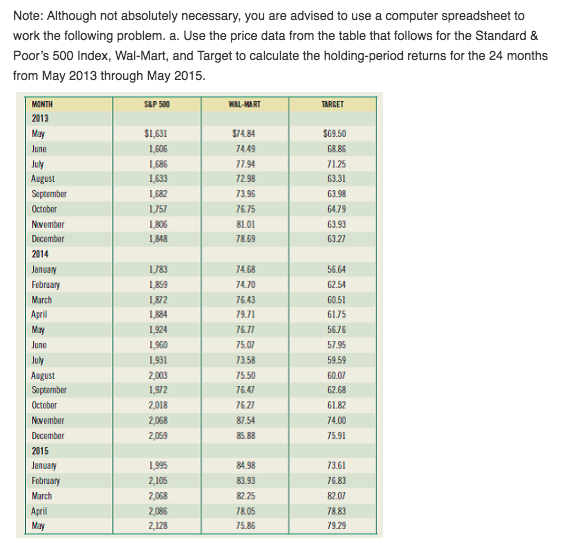
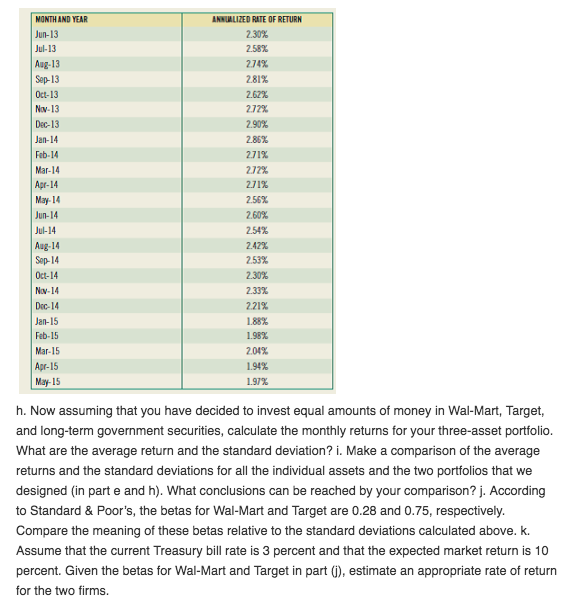
Note: Although not absolutely necessary, you are advised to use a computer spreadsheet to work the following problem. a. Use the price data from the table that follows for the Standard & Poor's 500 Index, Wal-Mart, and Target to calculate the holding-period returns for the 24 months from May 2013 through May 2015 SAP 500 WAL-MART 2013 $74.84 74.49 77.94 1,631 71.25 1,633 73.95 76.75 8101 7869 63.98 64.79 63.93 Nvember 2014 Januay 1783 74.68 74.70 76.43 79.71 56.64 62.54 61.75 56.76 57.95 59.59 60.07 62.68 61.82 74.00 75.91 75.07 7358 75.50 76.47 Nvember 2,068 87.54 85.88 2015 73.61 76.83 82.07 8.83 84.98 82 25 7805 75.85 2,128 b. Calculate the average monthly holding-period returns and the standard deviation of these returns for the S&P 500 Index, Wal-Mart, and Target. c. Plot (1) the holding-period returns for Wal-Mart against the Standard & Poor's 500 Index, and (2) the Target holding-period returns against the Standard & Poor's 500 Index. (Use Figure 6-5 as the format for your graph.) d. From your graphs in part (c), describe the nature of the relationship between the stock returns for Wal Mart and the returns for the S&P 500 Index. Make the same comparison for Target. e. Assume that you have decided to invest one-half of your money in Wal-Mart and the remainder in Target. Calculate the monthly holding-period returns for your two-stock portfolio. (Hint: The monthly return for the portfolio is the average of the two stocks' monthly returns.) f. Plot the returns of your two-stock portfolio against the Standard & Poor's 500 Index as you did for the individual stocks in part (c). How does this graph compare to the graphs for the individual stocks? Explain the difference. g. The following table shows the returns on an annualized basis that were realized from holding long-term government bonds for the same period. Calculate the average monthly holding-period returns and the standard deviations of these returns. (Hint: You will need to convert the annual returns to monthly returns by dividing each return by 12 months.) MONTH AND YEAR Jun-13 Jul-13 Aug-13 13 Oct-13 Nov-13 Dec-13 Jan-14 Feb-14 Mar-14 Apr-14 May-14 Jun-14 Jul-14 Aug-14 Sep-14 Oct-14 Nov-14 Dec-14 Jan-15 Feb-15 Mar-15 Apr-15 May-15 ANNUALIZED RATE OF RETURN 2.30% 2.58% 274% 2.81% 2.62% 277% 2.90% 2.86% 2.71% 272% 2.71% 2.56% 2.60% 2.54% 2.42% 2.53% 2.30% 2.33% 2.21% 188% 1.98% 2.04% 1.94% 1.97% h. Now assuming that you have decided to invest equal amounts of money in Wal-Mart, Target, and long-term government securities, calculate the monthly returns for your three-asset portfolio. What are the average return and the standard deviation? i. Make a comparison of the average returns and the standard deviations for all the individual assets and the two portfolios that we designed (in part e and h). What conclusions can be reached by your comparison? j. According to Standard & Poor's, the betas for Wal-Mart and Target are 0.28 and 0.75, respectively Compare the meaning of these betas relative to the standard deviations calculated above. k. Assume that the current Treasury bill rate is 3 percent and that the expected market return is 10 percent. Given the betas for Wal-Mart and Target in part (), estimate an appropriate rate of return for the two firms. Note: Although not absolutely necessary, you are advised to use a computer spreadsheet to work the following problem. a. Use the price data from the table that follows for the Standard & Poor's 500 Index, Wal-Mart, and Target to calculate the holding-period returns for the 24 months from May 2013 through May 2015 SAP 500 WAL-MART 2013 $74.84 74.49 77.94 1,631 71.25 1,633 73.95 76.75 8101 7869 63.98 64.79 63.93 Nvember 2014 Januay 1783 74.68 74.70 76.43 79.71 56.64 62.54 61.75 56.76 57.95 59.59 60.07 62.68 61.82 74.00 75.91 75.07 7358 75.50 76.47 Nvember 2,068 87.54 85.88 2015 73.61 76.83 82.07 8.83 84.98 82 25 7805 75.85 2,128 b. Calculate the average monthly holding-period returns and the standard deviation of these returns for the S&P 500 Index, Wal-Mart, and Target. c. Plot (1) the holding-period returns for Wal-Mart against the Standard & Poor's 500 Index, and (2) the Target holding-period returns against the Standard & Poor's 500 Index. (Use Figure 6-5 as the format for your graph.) d. From your graphs in part (c), describe the nature of the relationship between the stock returns for Wal Mart and the returns for the S&P 500 Index. Make the same comparison for Target. e. Assume that you have decided to invest one-half of your money in Wal-Mart and the remainder in Target. Calculate the monthly holding-period returns for your two-stock portfolio. (Hint: The monthly return for the portfolio is the average of the two stocks' monthly returns.) f. Plot the returns of your two-stock portfolio against the Standard & Poor's 500 Index as you did for the individual stocks in part (c). How does this graph compare to the graphs for the individual stocks? Explain the difference. g. The following table shows the returns on an annualized basis that were realized from holding long-term government bonds for the same period. Calculate the average monthly holding-period returns and the standard deviations of these returns. (Hint: You will need to convert the annual returns to monthly returns by dividing each return by 12 months.) MONTH AND YEAR Jun-13 Jul-13 Aug-13 13 Oct-13 Nov-13 Dec-13 Jan-14 Feb-14 Mar-14 Apr-14 May-14 Jun-14 Jul-14 Aug-14 Sep-14 Oct-14 Nov-14 Dec-14 Jan-15 Feb-15 Mar-15 Apr-15 May-15 ANNUALIZED RATE OF RETURN 2.30% 2.58% 274% 2.81% 2.62% 277% 2.90% 2.86% 2.71% 272% 2.71% 2.56% 2.60% 2.54% 2.42% 2.53% 2.30% 2.33% 2.21% 188% 1.98% 2.04% 1.94% 1.97% h. Now assuming that you have decided to invest equal amounts of money in Wal-Mart, Target, and long-term government securities, calculate the monthly returns for your three-asset portfolio. What are the average return and the standard deviation? i. Make a comparison of the average returns and the standard deviations for all the individual assets and the two portfolios that we designed (in part e and h). What conclusions can be reached by your comparison? j. According to Standard & Poor's, the betas for Wal-Mart and Target are 0.28 and 0.75, respectively Compare the meaning of these betas relative to the standard deviations calculated above. k. Assume that the current Treasury bill rate is 3 percent and that the expected market return is 10 percent. Given the betas for Wal-Mart and Target in part (), estimate an appropriate rate of return for the two firms