Please compute last 2 parts.
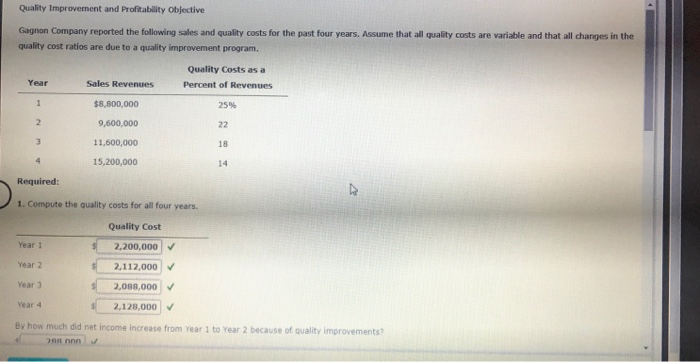
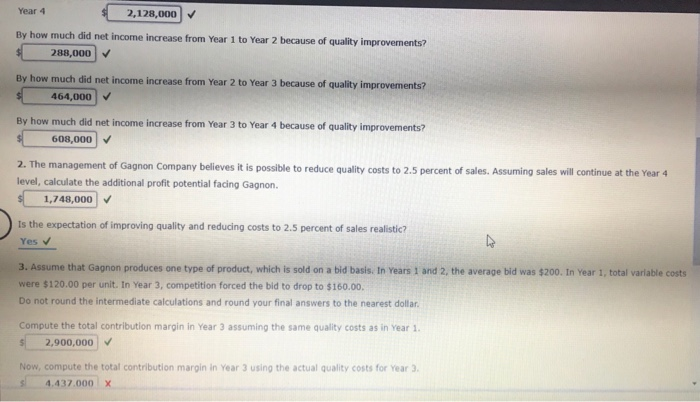
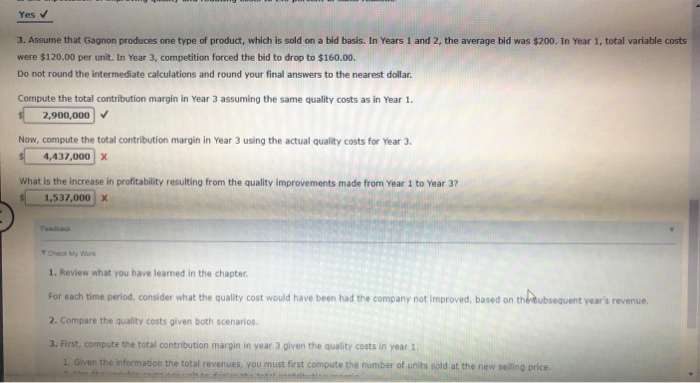
Quality Improvernent and Profitability Objective Gagnon Company reported the following sales and quality costs for the past four years. Assume that all quality costs are variable and that all changes in the quality cost ratios are due to a quality improvement program. Quality Costs as a Percent of Revenues Year Sales Revenues $8,800,000 9,600,000 11,600,000 15,200,000 25% 18 14 Required 1. Compute the quality costs for all four years. Quality Cost Year 1 Year 2 Year 3 Year 4 By how much did net income increase from Year 1 to Year 2 because of quality improvements? 2,200,000 2,112,000 2,088,000 2,128,000 Year 4 2,128,000 By how much did net income increase from Year 1 to Year 2 because of quality improvements? 288,000 By how much did net income increase from Year 2 to Year 3 because of quality improvements? 464,000 By how much did net income increase from Year 3 to Year 4 because of quality improvements? 608,000 2. The management of Gagnon Company believes it is possible to reduce quality costs to 2.5 percent of sales. Assuming sales will continue at the Year 4 level, calculate the additional profit potential facing Gagnon. 1,748,000 ts the expectation of improving quality and reducing costs to 2.5 percent of sales realistic? 3. Assume that Gagnon produces one type of product, which is sold on a bid basis. In Years 1 and 2, the average bid was $200. In Year 1, total variable costs were $120.00 per unit. In Year 3, competition forced the bid to drop to $160.00. Do not round the intermediate calculations and round your final answers to the nearest dollar Compute the total contribution margin in Year 3 assuming the same quality costs as in Year 1. 2,900,000 Now, compute the total contribution margin in Year 3 using the actual quality costs for Year 3 4.437.000 x Yes v 3. Assume that Gagnon produces one type of product, which is sold on a bid basis. In Years 1 and 2, the average bid was $200. In Year 1, total variable costs were $120.00 per unit. In Year 3, competition forced the bid to drop to $160.00. Do not round the intermediate calculations and round your final answers to the nearest dollar. Compute the total contribution margin in Year 3 assuming the same quality costs as in Year 1. 2,900,000 Now, compute the total contribution margin in Year 3 using the actual quality costs for Year 3 4,437,000X What is the increase in profitability resulting from the quality improvements made from Year 1 to Year 37 1,537,000 x 1. Review what you have learned in the chapter For each time perlod, consider what the quality cost would have been had the company not improved, based on th dubsequent year's revenue 2. Compare the quality costs given both scenarios 3. First, compute the total contribution margin in year 3 given the quality costs in year 1 1. Given the information the total revenues, you must first compute the number of units sold at the new selling price