Answered step by step
Verified Expert Solution
Question
1 Approved Answer
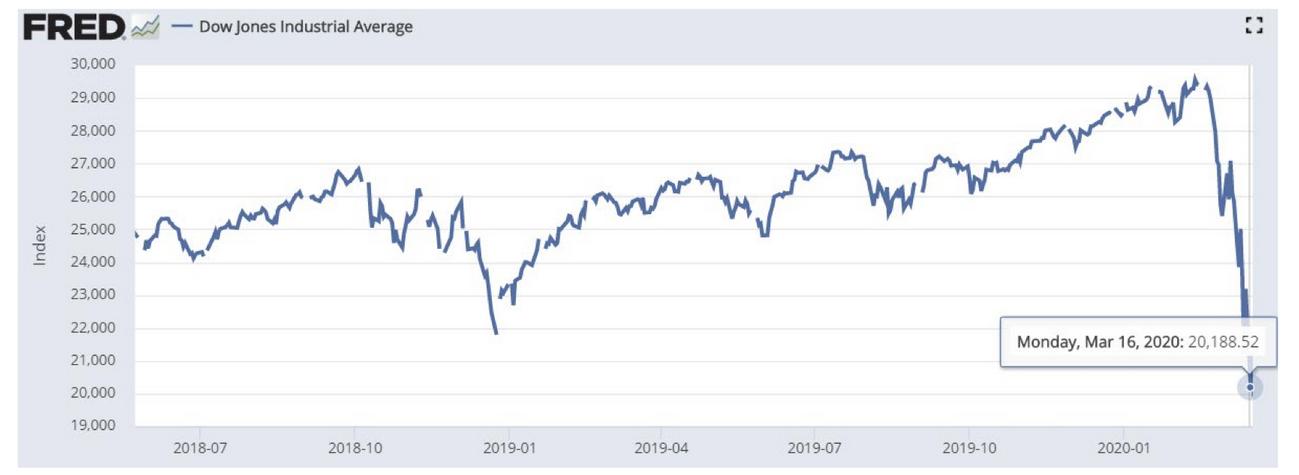
Please consider the time-series graph below of the Dow Jones Industrial Average (DJIA) from May 23, 2018 to March 17, 2020. The graph indicates that
Please consider the time-series graph below of the Dow Jones Industrial Average (DJIA) from May 23, 2018 to March 17, 2020. The graph indicates that relative to the recent past (May 23, 2018 onward), stock prices on March 16, 2020 were exceedingly low. In a few sentences, please explain why I’ve chosen the DJIA to represent stock prices and then use the dividend-discount model to explain why a decrease in stock prices could be a good indication that the economy is not expected to do well.

FRED 30,000 29,000 28.000 27,000 26,000 25,000 24,000 23,000 22,000 21,000 20,000 19,000 Index Dow Jones Industrial Average w 2018-07 way 2018-10 2019-01 2019-04 2019-07 2019-10 Monday, Mar 16, 2020: 20,188.52 2020-01
Step by Step Solution
★★★★★
3.36 Rating (152 Votes )
There are 3 Steps involved in it
Step: 1
The Dow Jones Industrial Average DJIA is a type stock market index that tracks 30 large publiclyowned bluechip companies trading on the New York Stock Exchange and the NASDAQ The Dow Jones is named af...
Get Instant Access to Expert-Tailored Solutions
See step-by-step solutions with expert insights and AI powered tools for academic success
Step: 2

Step: 3

Ace Your Homework with AI
Get the answers you need in no time with our AI-driven, step-by-step assistance
Get Started


