Answered step by step
Verified Expert Solution
Question
1 Approved Answer
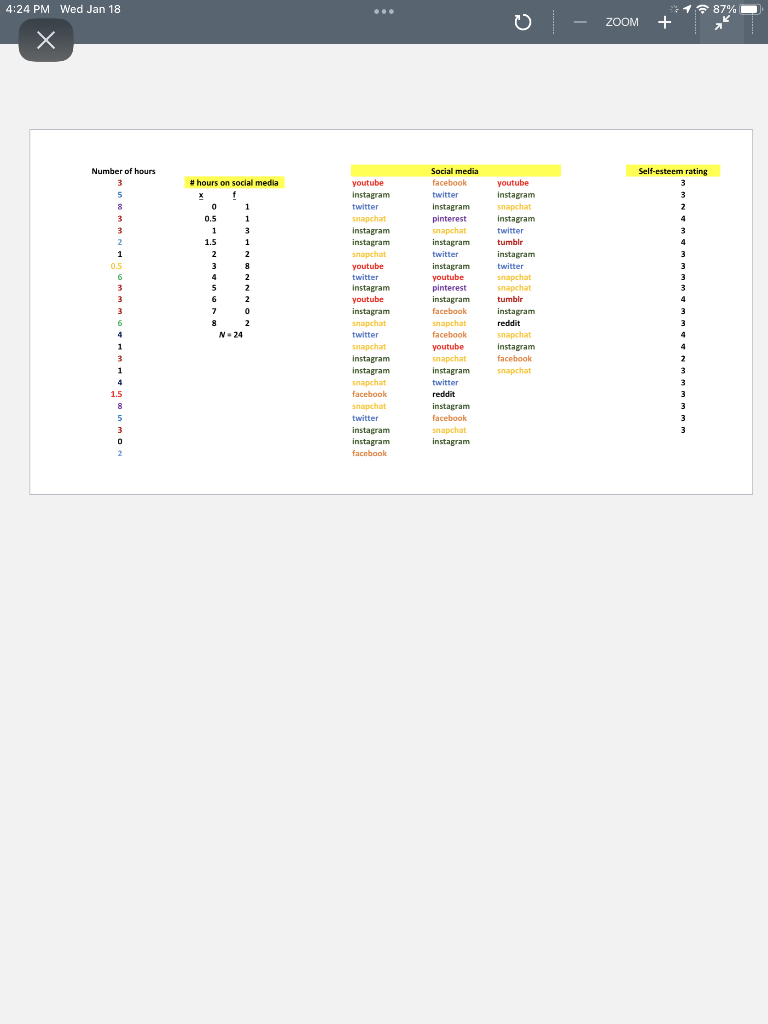
Please create the graphs needed below or provide the mathThe excel has has data for 3 variables: number of hours spent on social media, social
Please create the graphs needed below or provide the mathThe excel has has data for variables: number of hours spent on social media, social media preference, and selfesteem ratings. Your task is to create the appropriate graph for each variable graphs total as we covered in chapter Note the graphs do not need be done on excel or other computer program. You can draw them out by hand, and upload a photo: PM Wed Jan
Number of hours
table# hours on social med
tableyoutubeSocial media,instagramfacebook,youtubetwittertwitter,instagramsnapchatinstagram,snapchatinstagramsinterestinstagraminstagraminstagram,twittersnapchattwitter,instagramyoutubeinstagram,twittertwitteryoutube,snapchatinstagrampinterest,snapchatyoutubeinstagram,tumblrinstagramfacebook,instagramsnapchat:snapchat,reddittwitterfacebook,snapchatsnapchatyoutube,instagraminstagramsnapchat,facebookinstagraminstagram,snapchatsnapchattwitter,facebookreddit,snapchatinstagram,twitterfacebook,instagramsnapchat,instagraminstagram,facebook
Selfesteem rating

Step by Step Solution
There are 3 Steps involved in it
Step: 1

Get Instant Access to Expert-Tailored Solutions
See step-by-step solutions with expert insights and AI powered tools for academic success
Step: 2

Step: 3

Ace Your Homework with AI
Get the answers you need in no time with our AI-driven, step-by-step assistance
Get Started


