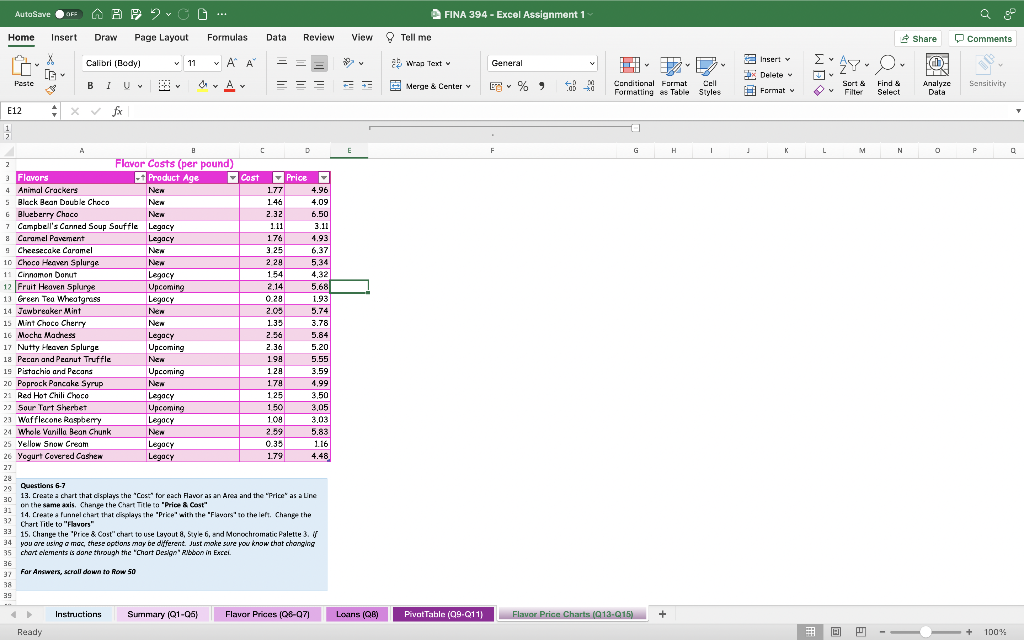
Please Describe how to complete all steps in this excel problem. Thank you

AutoSave OF AAP 2G ... FINA 394 - Excel Assignment 1 Home Insert Draw Page Layout Formulas Data Review View Tell me Share Comments Insert v Calibri (body) v 11 ~ Al A General X LE Wran Text v Y Delete Paste BIU Oy Av = = - y Merge & Center ETA % % Conditional Format Cell Formatting as Table Styles Sensitivity Format v Sort & Filter v Find & Select Analyze Data y E12 X fx 1 E F G H 1 L M N P 0 A B C 2 Flavor Costs (per pound) 3 Flavors - Product Age Cost Price 4 Animal Crackers Nen 1.77 4.96 5 Black Bean Double Choco NEN 146 4.09 6 Blueberry Choco Nen 2.32 6.50 7 Campbell's Canned Soup Souffle Legacy 1.11 3.11 & Caramel Pavement Legacy 176 4.93 9 Cheesecake Carame New 3 25 6.37 10 Choco Heaven Splurge Ned 2.29 5.34 11 Cinnamon Dorut Legacy 154 4,32 12 Fruit Heaven Splurye Upcoming 2.14 5.68 13 Green Tea Wheatgrass Legacy 0.28 1.93 14 Jawbreaker Mint Nen 2.09 5.74 15 Mint Choco Cherry Nen 133 3.78 16 Mocha Madress Legacy 2.56 5.84 17 Nutty Heaven Splurge Upcoming 2.36 5.20 18 Pecan and Peanut Truffle NEN 198 5.55 19 Pistachio and Pecans Upcoming 128 3.59 20 Poprock Pancake Syrup Nen 179 4,99 21 Red Hot Chili Choco Legacy 1 25 3,50 22 Sour Tart Sherbet Upcoming 150 3,05 23 Wafflecone Raspberry Legacy 1.09 3.03 24 Whole Vanilla Bean Chunk Nem 2.59 5.83 25 Yellow Snow Cream Legacy 0.35 1.16 26 Yogurt Covered Cashew 179 4.48 27 28 29 Questions 6-7 30 13. Create a chart that cisplays the "Cost" for each Flavor as an Area and the Price as a Line on the same axis. Change the Chart Titleta "Price & Cast 31 14. Crearea lunnelchart that displays the "Price' with the "Flavars' to the left. Change the 32 Chart Title to "Flavors" 33 32 15. Change the "Price & Cost" chart to use Layout 8, Style 6, and Morochromatic Palette 3. V 34 you are using a moc, these options may be different. Just make sure you know that changing 35 chart elements is done through the "Chart Design Ribbon in Excel 36 37 For Answers, scroll down to Row 50 38 35 Legacy Instructions Summary (Q1-05) Flavor Prices (06-07) Loans (QB) Pivot Table (99-Q11) Flavor Price Charts (13.015) + Ready S: + 100% % AutoSave OF AAP 2G ... FINA 394 - Excel Assignment 1 Home Insert Draw Page Layout Formulas Data Review View Tell me Share Comments Insert v Calibri (body) v 11 ~ Al A General X LE Wran Text v Y Delete Paste BIU Oy Av = = - y Merge & Center ETA % % Conditional Format Cell Formatting as Table Styles Sensitivity Format v Sort & Filter v Find & Select Analyze Data y E12 X fx 1 E F G H 1 L M N P 0 A B C 2 Flavor Costs (per pound) 3 Flavors - Product Age Cost Price 4 Animal Crackers Nen 1.77 4.96 5 Black Bean Double Choco NEN 146 4.09 6 Blueberry Choco Nen 2.32 6.50 7 Campbell's Canned Soup Souffle Legacy 1.11 3.11 & Caramel Pavement Legacy 176 4.93 9 Cheesecake Carame New 3 25 6.37 10 Choco Heaven Splurge Ned 2.29 5.34 11 Cinnamon Dorut Legacy 154 4,32 12 Fruit Heaven Splurye Upcoming 2.14 5.68 13 Green Tea Wheatgrass Legacy 0.28 1.93 14 Jawbreaker Mint Nen 2.09 5.74 15 Mint Choco Cherry Nen 133 3.78 16 Mocha Madress Legacy 2.56 5.84 17 Nutty Heaven Splurge Upcoming 2.36 5.20 18 Pecan and Peanut Truffle NEN 198 5.55 19 Pistachio and Pecans Upcoming 128 3.59 20 Poprock Pancake Syrup Nen 179 4,99 21 Red Hot Chili Choco Legacy 1 25 3,50 22 Sour Tart Sherbet Upcoming 150 3,05 23 Wafflecone Raspberry Legacy 1.09 3.03 24 Whole Vanilla Bean Chunk Nem 2.59 5.83 25 Yellow Snow Cream Legacy 0.35 1.16 26 Yogurt Covered Cashew 179 4.48 27 28 29 Questions 6-7 30 13. Create a chart that cisplays the "Cost" for each Flavor as an Area and the Price as a Line on the same axis. Change the Chart Titleta "Price & Cast 31 14. Crearea lunnelchart that displays the "Price' with the "Flavars' to the left. Change the 32 Chart Title to "Flavors" 33 32 15. Change the "Price & Cost" chart to use Layout 8, Style 6, and Morochromatic Palette 3. V 34 you are using a moc, these options may be different. Just make sure you know that changing 35 chart elements is done through the "Chart Design Ribbon in Excel 36 37 For Answers, scroll down to Row 50 38 35 Legacy Instructions Summary (Q1-05) Flavor Prices (06-07) Loans (QB) Pivot Table (99-Q11) Flavor Price Charts (13.015) + Ready S: + 100% %


