PLEASE DISREGARD QUESTION THAT ASKS FOR ONLINE 9,19, AND 11
PLEASE SHOW ALL WORK USING EXCEL

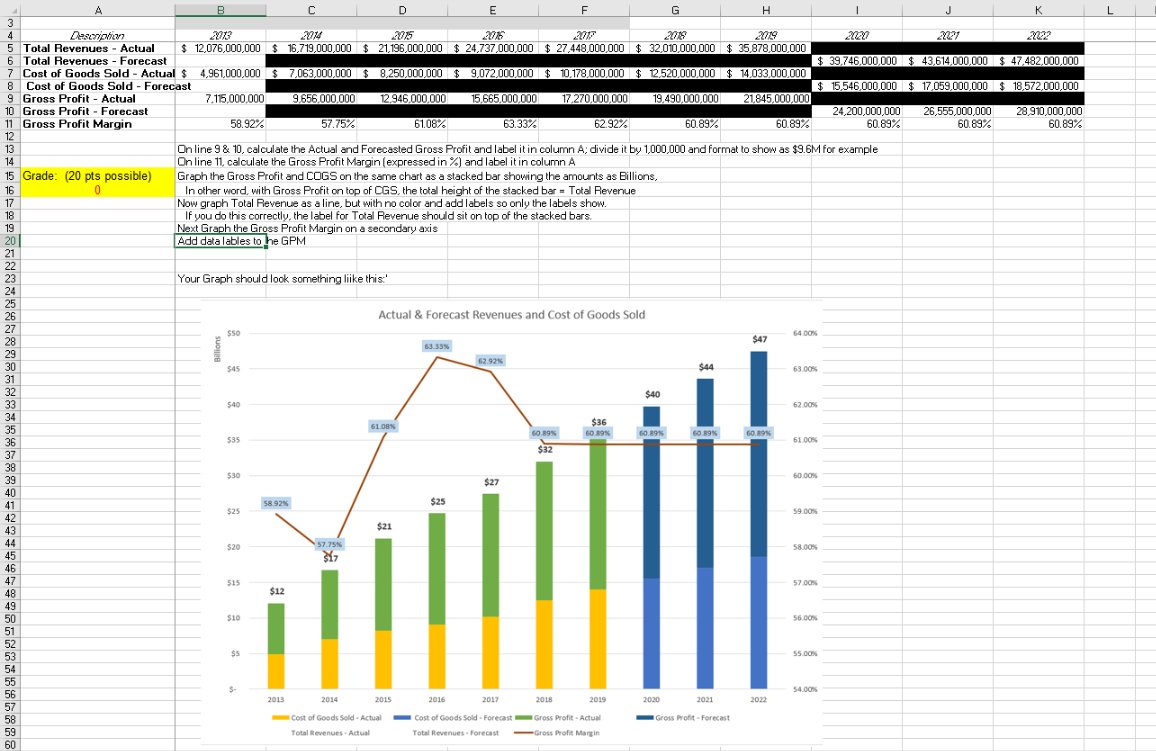
- L illions A B C D E F G H J K 3 4 Desc 2013 2015 2719 2019 2222 5 Total Revenues - Actual $ 12,076,000,000 $16,719,000,000 $ 21,196,000,000 $ 24,737,000,000 $ 27,448,000,000 $ 32,010,000,000 $ 35,878,000,000 6 Total Revenues - Forecast $ 39,746.000.000 $ 43,614.000.000 $ 47,482.000.000 Cost of Goods Sold - Actual $ 4,961,000,000 4,961,000,000 $ 7,063,000,000 $ 8,250,000,000 $ 9,072,000,000 $ 10,178,000,000 $12.520,000,000 $14.033.000.000 8 Cost of Goods Sold - Forecast $ 15,546,000,000 $17,059,000,000 $18,572,000,000 9 Gross Profit - Actual 7.115,000,000 9.656.000.000 12.946.000.000 15,665 000.000 17 270.000.000 19.490.000.000 21845,000,000 10 Gross Profit - Forecast 24,200,000,000 26,555,000,000 28,910,000,000 11 Gross Profit Margin 58.92% 57.75% 61.08% 63.33% 62.92% 60.89% 60.897 60.89% 60.89% 60.89% 12 13 On line 9 & 10, calculate the actual and Forecasted Gross Profit and label it in column A: divide it by 1,000,000 and format to show as $9.6M for example 14 Online 11, calculate the Gross Profit Margin (expressed in %) and label it in column A 15 Grade: (20 pts possible) Graph the Gross Profit and COGS on the same chart as a stacked bar showing the amounts as Billions, 16 0 In other word, with Gross Profit on top of CGS, the total height of the stacked bar = Total Revenue 17 Now graph Total Revenue as a line, but with no color and add labels so only the labels show. 18 If you do this correctly, the label for Total Revenue should sit on top of the stacked bars. 19 Next Graph the Gross Profit Margin on a secondary axis 20 Add datalables to he GPM 21 22 23 Your Graph should look something like this: 24 25 26 Actual & Forecast Revenues and Cost of Goods Sold 27 $50 64.00 28 $47 29 62.925 30 $45 $44 63.00% 31 32 $40 33 $40 62.00% 34 35 61.08% $36 50.89% 60.89% 60.89% 60.89 36 $35 6100% 37 $32 38 39 $30 60.00% $27 40 58.92% 41 $25 $25 59.00 42 43 $21 44 $20 57.75 58.00% 45 SAT 46 47 $15 57.00% 48 $12 49 50 $10 56.00% 51 52 53 $5 55.00 54 55 S. 54.00% 56 2013 2014 2015 2016 2017 2018 2019 2020 2021 2022 57 58 -Cost of Goods Sold - Actual Cost of Goods Sold - Forecast-Gross Profit - Actual -Gross Profit - Forecast 59 Total Revenues. Actual Total Revenues. Forecast Gross Profit Margin 60 - L illions A B C D E F G H J K 3 4 Desc 2013 2015 2719 2019 2222 5 Total Revenues - Actual $ 12,076,000,000 $16,719,000,000 $ 21,196,000,000 $ 24,737,000,000 $ 27,448,000,000 $ 32,010,000,000 $ 35,878,000,000 6 Total Revenues - Forecast $ 39,746.000.000 $ 43,614.000.000 $ 47,482.000.000 Cost of Goods Sold - Actual $ 4,961,000,000 4,961,000,000 $ 7,063,000,000 $ 8,250,000,000 $ 9,072,000,000 $ 10,178,000,000 $12.520,000,000 $14.033.000.000 8 Cost of Goods Sold - Forecast $ 15,546,000,000 $17,059,000,000 $18,572,000,000 9 Gross Profit - Actual 7.115,000,000 9.656.000.000 12.946.000.000 15,665 000.000 17 270.000.000 19.490.000.000 21845,000,000 10 Gross Profit - Forecast 24,200,000,000 26,555,000,000 28,910,000,000 11 Gross Profit Margin 58.92% 57.75% 61.08% 63.33% 62.92% 60.89% 60.897 60.89% 60.89% 60.89% 12 13 On line 9 & 10, calculate the actual and Forecasted Gross Profit and label it in column A: divide it by 1,000,000 and format to show as $9.6M for example 14 Online 11, calculate the Gross Profit Margin (expressed in %) and label it in column A 15 Grade: (20 pts possible) Graph the Gross Profit and COGS on the same chart as a stacked bar showing the amounts as Billions, 16 0 In other word, with Gross Profit on top of CGS, the total height of the stacked bar = Total Revenue 17 Now graph Total Revenue as a line, but with no color and add labels so only the labels show. 18 If you do this correctly, the label for Total Revenue should sit on top of the stacked bars. 19 Next Graph the Gross Profit Margin on a secondary axis 20 Add datalables to he GPM 21 22 23 Your Graph should look something like this: 24 25 26 Actual & Forecast Revenues and Cost of Goods Sold 27 $50 64.00 28 $47 29 62.925 30 $45 $44 63.00% 31 32 $40 33 $40 62.00% 34 35 61.08% $36 50.89% 60.89% 60.89% 60.89 36 $35 6100% 37 $32 38 39 $30 60.00% $27 40 58.92% 41 $25 $25 59.00 42 43 $21 44 $20 57.75 58.00% 45 SAT 46 47 $15 57.00% 48 $12 49 50 $10 56.00% 51 52 53 $5 55.00 54 55 S. 54.00% 56 2013 2014 2015 2016 2017 2018 2019 2020 2021 2022 57 58 -Cost of Goods Sold - Actual Cost of Goods Sold - Forecast-Gross Profit - Actual -Gross Profit - Forecast 59 Total Revenues. Actual Total Revenues. Forecast Gross Profit Margin 60


