Please do a brief financial statement analysis over the HCA Healthcare company, including but not limited to the following:
- 10 ratio analysis and interpretation
- Commentary on the income statement, balance sheet, statement of cash flows
- Trend analysis comparing current year performance to recent past years performance


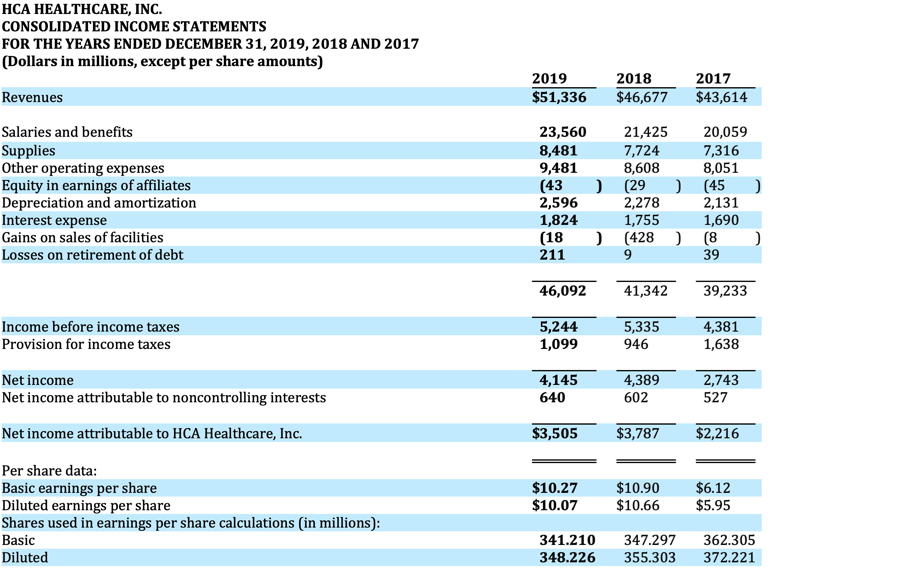
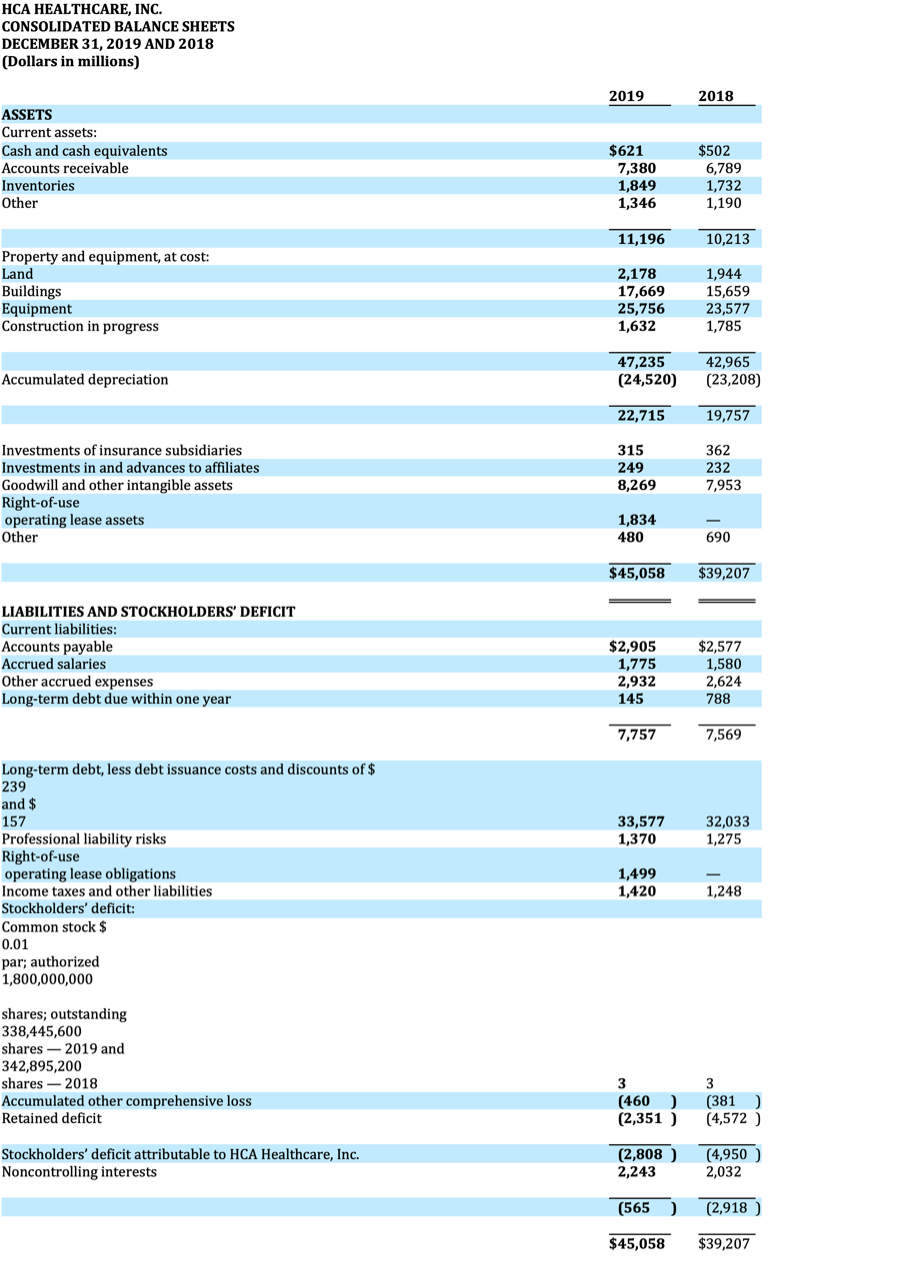
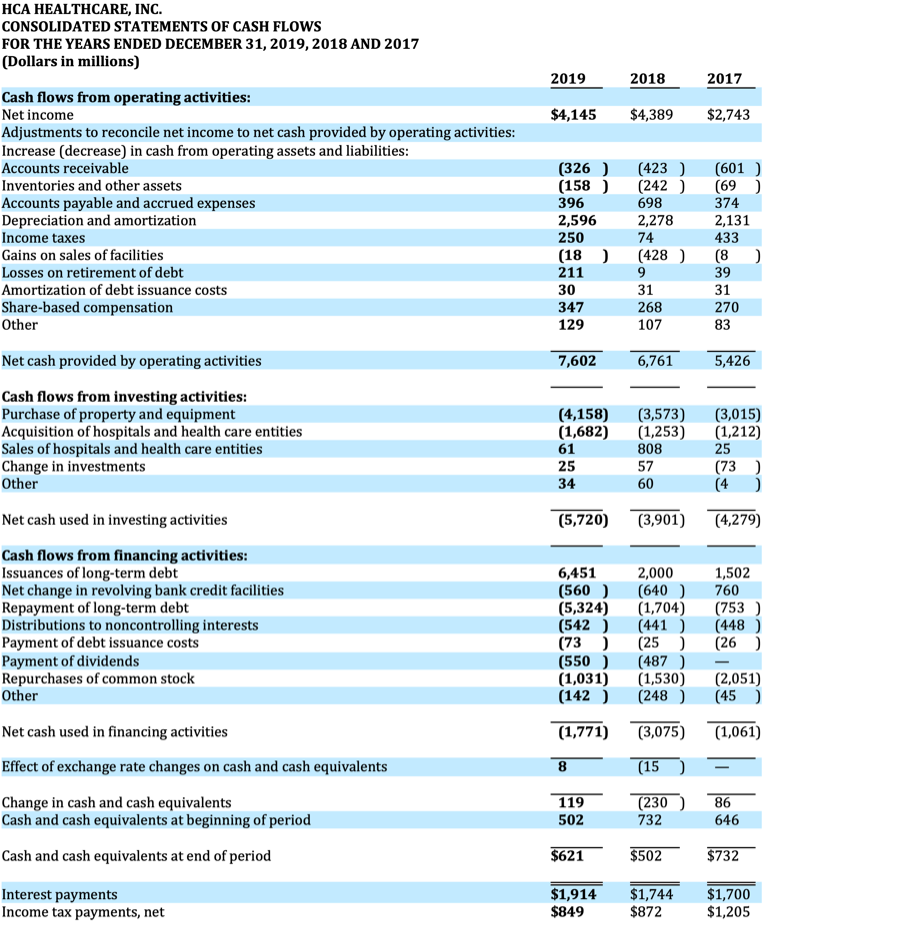
HCA HEALTHCARE, INC. CONSOLIDATED INCOME STATEMENTS FOR THE YEARS ENDED DECEMBER 31, 2019, 2018 AND 2017 (Dollars in millions, except per share amounts) Revenues 2019 $51,336 2018 $46,677 2017 $43,614 Salaries and benefits Supplies Other operating expenses Equity in earnings of affiliates Depreciation and amortization Interest expense Gains on sales of facilities Losses on retirement of debt 23,560 8,481 9,481 (43 2,596 1,824 (18 211 21,425 20,059 7,724 7,316 8,608 8,051 ) (29 ) (45 2,278 2,131 1,755 1,690 ) (428) (8 9 ) ) 39 46,092 41,342 39,233 5,335 Income before income taxes Provision for income taxes 5,244 1,099 946 4,381 1,638 Net income Net income attributable to noncontrolling interests 4,145 640 4,389 602 2,743 527 Net income attributable to HCA Healthcare, Inc. $3,505 $3,787 $2,216 Per share data: Basic earnings per share Diluted earnings per share Shares used in earnings per share calculations in millions): Basic Diluted $10.27 $10.07 $10.90 $10.66 $6.12 $5.95 341.210 348.226 347.297 355.303 362.305 372.221 HCA HEALTHCARE, INC. CONSOLIDATED BALANCE SHEETS DECEMBER 31, 2019 AND 2018 (Dollars in millions) 2019 2018 ASSETS Current assets: Cash and cash equivalents Accounts receivable Inventories Other $621 7,380 $502 6,789 1,732 1,190 1,849 1,346 11,196 10,213 Property and equipment, at cost: Land Buildings Equipment Construction in progress 2,178 17,669 25,756 1,632 1,944 15,659 23,577 1,785 Accumulated depreciation 47,235 (24,520) 42,965 (23,208) 22,715 19,757 Investments of insurance subsidiaries Investments in and advances to affiliates Goodwill and other intangible assets Right-of-use operating lease assets Other 315 249 8,269 362 232 7,953 1,834 480 690 $45,058 $39,207 LIABILITIES AND STOCKHOLDERS' DEFICIT Current liabilities: Accounts payable Accrued salaries Other accrued expenses Long-term debt due within one year $2,905 1,775 2,932 145 $2,577 1,580 2,624 788 7,757 7,569 Long-term debt, less debt issuance costs and discounts of $ 239 and $ 157 33,577 1,370 32,033 1,275 1,499 1,420 1,248 Professional liability risks Right-of-use operating se obligatio Income taxes and other liabilities Stockholders' deficit: Common stock $ 0.01 par; authorized 1,800,000,000 shares; outstanding 338,445,600 shares - 2019 and 342,895,200 shares - 2018 Accumulated other comprehensive loss Retained deficit 3 (460 ) (2,351 ) 3 (381) (4,572 ) Stockholders' deficit attributable to HCA Healthcare, Inc. Noncontrolling interests (2,808 ) 2,243 (4,950) 2,032 (565 ) (2,918 ) $45,058 $39,207 HCA HEALTHCARE, INC. CONSOLIDATED STATEMENTS OF CASH FLOWS FOR THE YEARS ENDED DECEMBER 31, 2019, 2018 AND 2017 (Dollars in millions) 2019 2018 2017 $4,145 $4,389 $2,743 Cash flows from operating activities: Net income Adjustments to reconcile net income to net cash provided by operating activities: Increase (decrease) in cash from operating assets and liabilities: Accounts receivable Inventories and other assets Accounts payable and accrued expenses Depreciation and amortization Income taxes Gains on sales of facilities Losses on retirement of debt Amortization of debt issuance costs Share-based compensation Other (326) (158) 396 2,596 250 (18) 211 (423) (242) 698 2,278 74 (428) 9 31 268 107 (601) (69) 374 2,131 433 (8 ) 39 31 270 83 30 347 129 7,602 6,761 5,426 Net cash provided by operating activities Cash flows from investing activities: Purchase of property and equipment Acquisition of hospitals and health care entities Sales of hospitals and health care entities Change in investments Other (4,158) (1,682) 61 25 (3,573) (1,253) 808 (3,015) (1,212) 25 (73) (4 34 57 60 Net cash used in investing activities (5,720) (3,901) (4,279) Cash flows from financing activities: Issuances of long-term debt Net change in revolving bank credit facilities Repayment of long-term debt Distributions to noncontrolling interests Payment of debt issuance costs Payment of dividends Repurchases of common stock Other 6,451 (560) (5,324) (542) (73) (550) (1,031) (142) 2,000 (640) (1,704) (441) (25) (487) (1,530) (248) 1,502 760 (753) (448) (26) (2,051) (45) (1,771) (3,075) (1,061) 8 (15) Net cash used in financing activities Effect of exchange rate changes on cash and cash equivalents Change in cash and cash equivalents Cash and cash equivalents at beginning of period Cash and cash equivalents at end of period 86 119 502 (230 732 646 $621 $502 $732 Interest payments Income tax payments, net $1,914 $849 $1,744 $872 $1,700 $1,205 HCA HEALTHCARE, INC. CONSOLIDATED INCOME STATEMENTS FOR THE YEARS ENDED DECEMBER 31, 2019, 2018 AND 2017 (Dollars in millions, except per share amounts) Revenues 2019 $51,336 2018 $46,677 2017 $43,614 Salaries and benefits Supplies Other operating expenses Equity in earnings of affiliates Depreciation and amortization Interest expense Gains on sales of facilities Losses on retirement of debt 23,560 8,481 9,481 (43 2,596 1,824 (18 211 21,425 20,059 7,724 7,316 8,608 8,051 ) (29 ) (45 2,278 2,131 1,755 1,690 ) (428) (8 9 ) ) 39 46,092 41,342 39,233 5,335 Income before income taxes Provision for income taxes 5,244 1,099 946 4,381 1,638 Net income Net income attributable to noncontrolling interests 4,145 640 4,389 602 2,743 527 Net income attributable to HCA Healthcare, Inc. $3,505 $3,787 $2,216 Per share data: Basic earnings per share Diluted earnings per share Shares used in earnings per share calculations in millions): Basic Diluted $10.27 $10.07 $10.90 $10.66 $6.12 $5.95 341.210 348.226 347.297 355.303 362.305 372.221 HCA HEALTHCARE, INC. CONSOLIDATED BALANCE SHEETS DECEMBER 31, 2019 AND 2018 (Dollars in millions) 2019 2018 ASSETS Current assets: Cash and cash equivalents Accounts receivable Inventories Other $621 7,380 $502 6,789 1,732 1,190 1,849 1,346 11,196 10,213 Property and equipment, at cost: Land Buildings Equipment Construction in progress 2,178 17,669 25,756 1,632 1,944 15,659 23,577 1,785 Accumulated depreciation 47,235 (24,520) 42,965 (23,208) 22,715 19,757 Investments of insurance subsidiaries Investments in and advances to affiliates Goodwill and other intangible assets Right-of-use operating lease assets Other 315 249 8,269 362 232 7,953 1,834 480 690 $45,058 $39,207 LIABILITIES AND STOCKHOLDERS' DEFICIT Current liabilities: Accounts payable Accrued salaries Other accrued expenses Long-term debt due within one year $2,905 1,775 2,932 145 $2,577 1,580 2,624 788 7,757 7,569 Long-term debt, less debt issuance costs and discounts of $ 239 and $ 157 33,577 1,370 32,033 1,275 1,499 1,420 1,248 Professional liability risks Right-of-use operating se obligatio Income taxes and other liabilities Stockholders' deficit: Common stock $ 0.01 par; authorized 1,800,000,000 shares; outstanding 338,445,600 shares - 2019 and 342,895,200 shares - 2018 Accumulated other comprehensive loss Retained deficit 3 (460 ) (2,351 ) 3 (381) (4,572 ) Stockholders' deficit attributable to HCA Healthcare, Inc. Noncontrolling interests (2,808 ) 2,243 (4,950) 2,032 (565 ) (2,918 ) $45,058 $39,207 HCA HEALTHCARE, INC. CONSOLIDATED STATEMENTS OF CASH FLOWS FOR THE YEARS ENDED DECEMBER 31, 2019, 2018 AND 2017 (Dollars in millions) 2019 2018 2017 $4,145 $4,389 $2,743 Cash flows from operating activities: Net income Adjustments to reconcile net income to net cash provided by operating activities: Increase (decrease) in cash from operating assets and liabilities: Accounts receivable Inventories and other assets Accounts payable and accrued expenses Depreciation and amortization Income taxes Gains on sales of facilities Losses on retirement of debt Amortization of debt issuance costs Share-based compensation Other (326) (158) 396 2,596 250 (18) 211 (423) (242) 698 2,278 74 (428) 9 31 268 107 (601) (69) 374 2,131 433 (8 ) 39 31 270 83 30 347 129 7,602 6,761 5,426 Net cash provided by operating activities Cash flows from investing activities: Purchase of property and equipment Acquisition of hospitals and health care entities Sales of hospitals and health care entities Change in investments Other (4,158) (1,682) 61 25 (3,573) (1,253) 808 (3,015) (1,212) 25 (73) (4 34 57 60 Net cash used in investing activities (5,720) (3,901) (4,279) Cash flows from financing activities: Issuances of long-term debt Net change in revolving bank credit facilities Repayment of long-term debt Distributions to noncontrolling interests Payment of debt issuance costs Payment of dividends Repurchases of common stock Other 6,451 (560) (5,324) (542) (73) (550) (1,031) (142) 2,000 (640) (1,704) (441) (25) (487) (1,530) (248) 1,502 760 (753) (448) (26) (2,051) (45) (1,771) (3,075) (1,061) 8 (15) Net cash used in financing activities Effect of exchange rate changes on cash and cash equivalents Change in cash and cash equivalents Cash and cash equivalents at beginning of period Cash and cash equivalents at end of period 86 119 502 (230 732 646 $621 $502 $732 Interest payments Income tax payments, net $1,914 $849 $1,744 $872 $1,700 $1,205


