Answered step by step
Verified Expert Solution
Question
1 Approved Answer
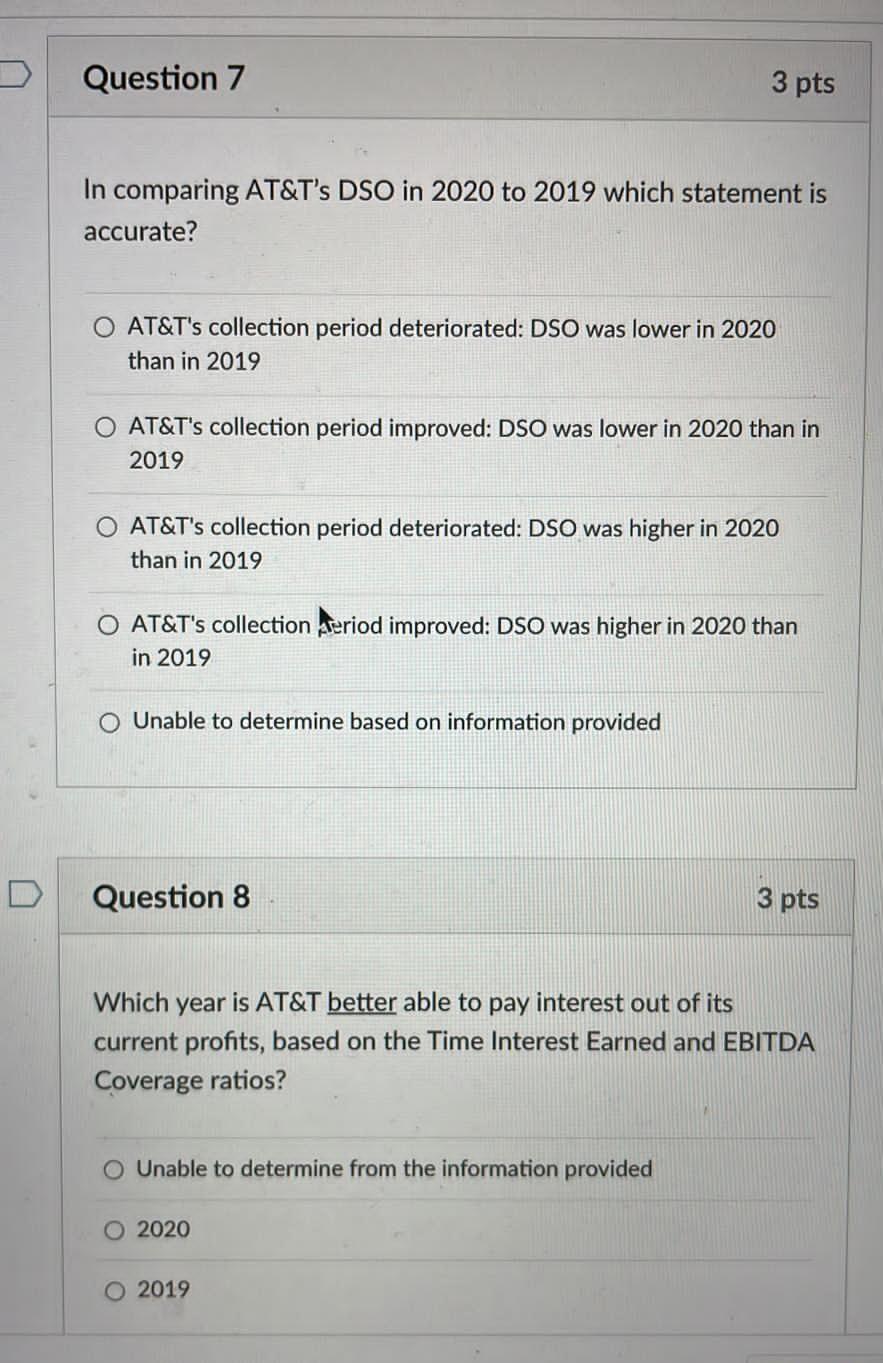
please do it in 10 minutes will upvote Question 7 3 pts In comparing AT&T's DSO in 2020 to 2019 which statement is accurate? AT&T's
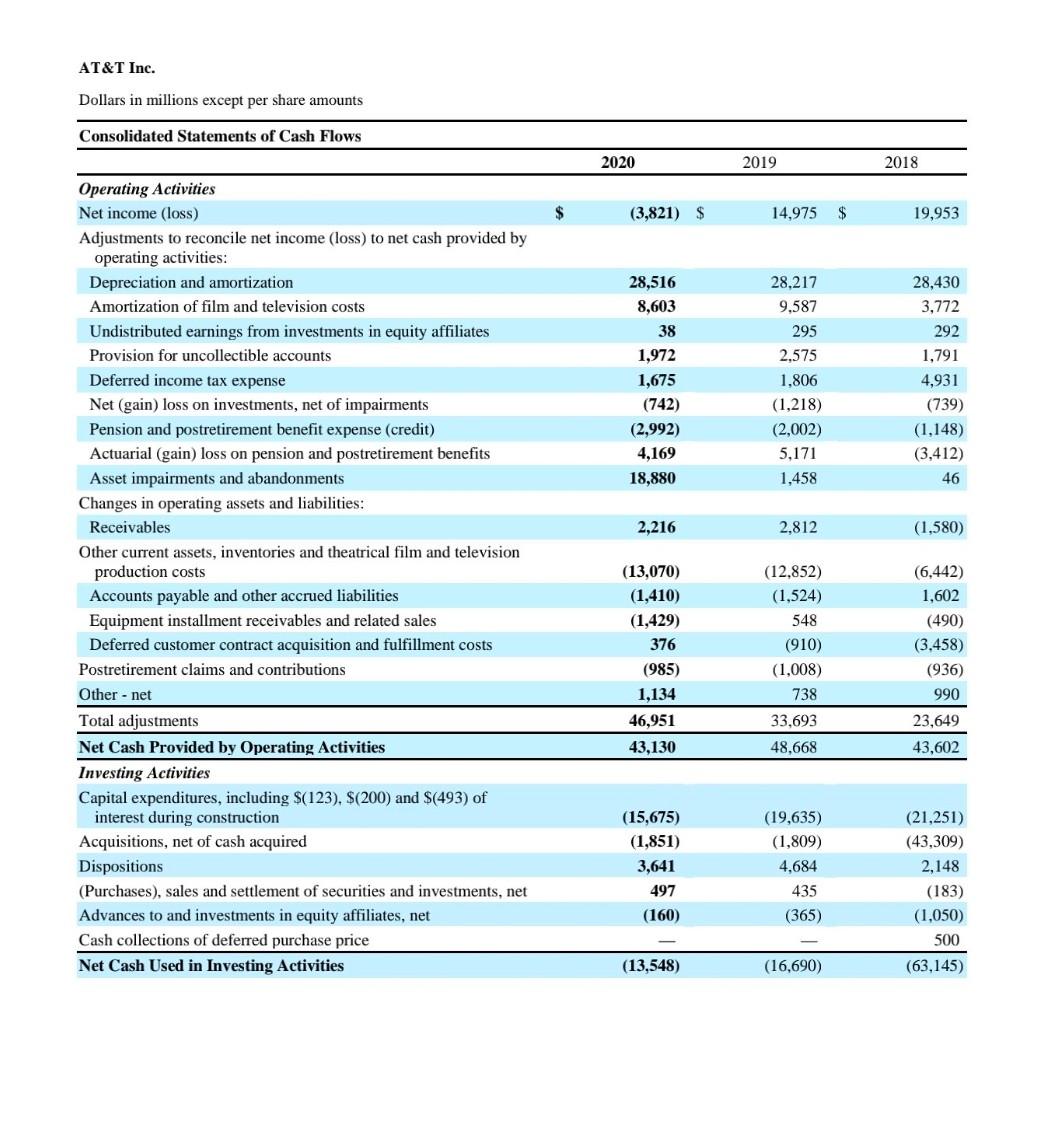
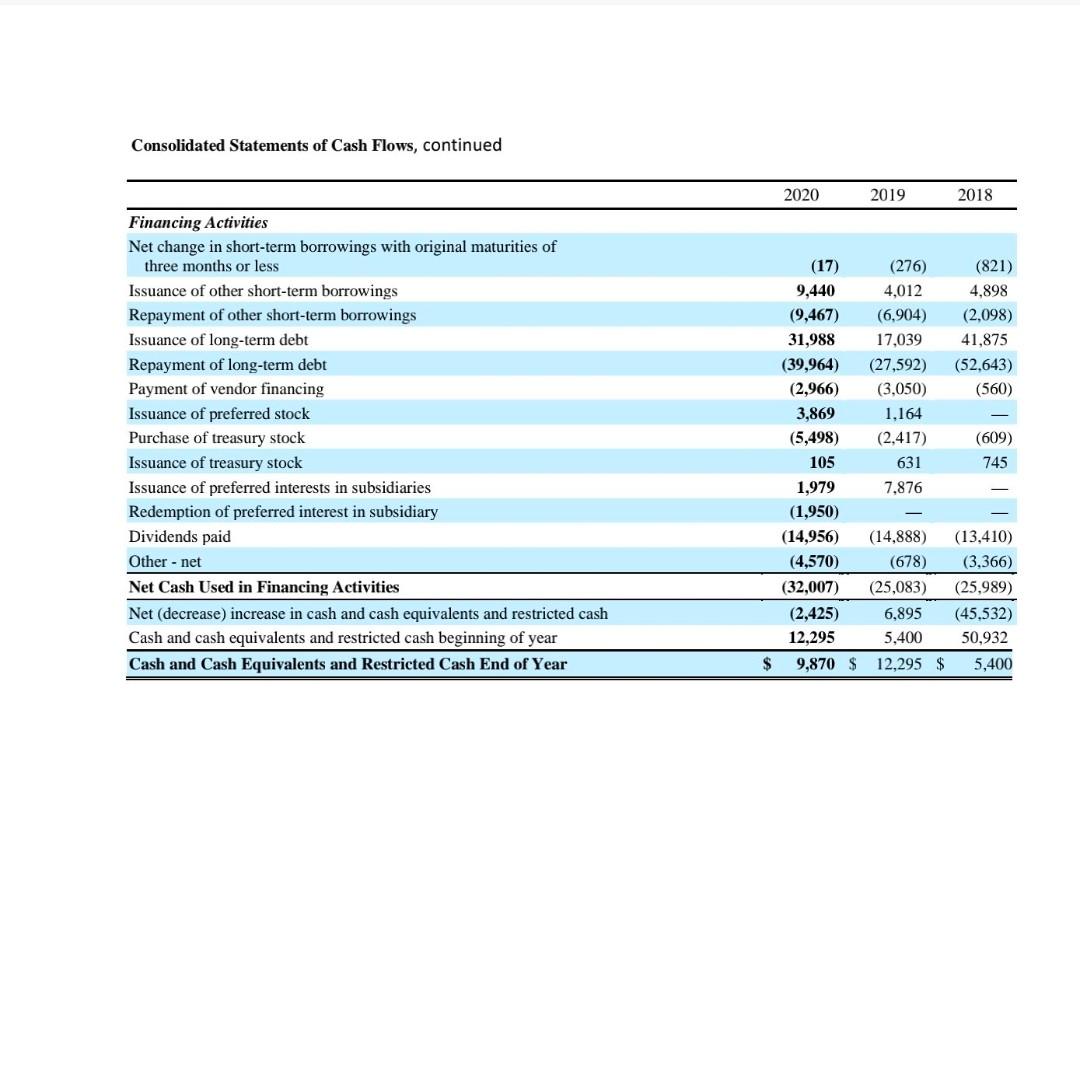
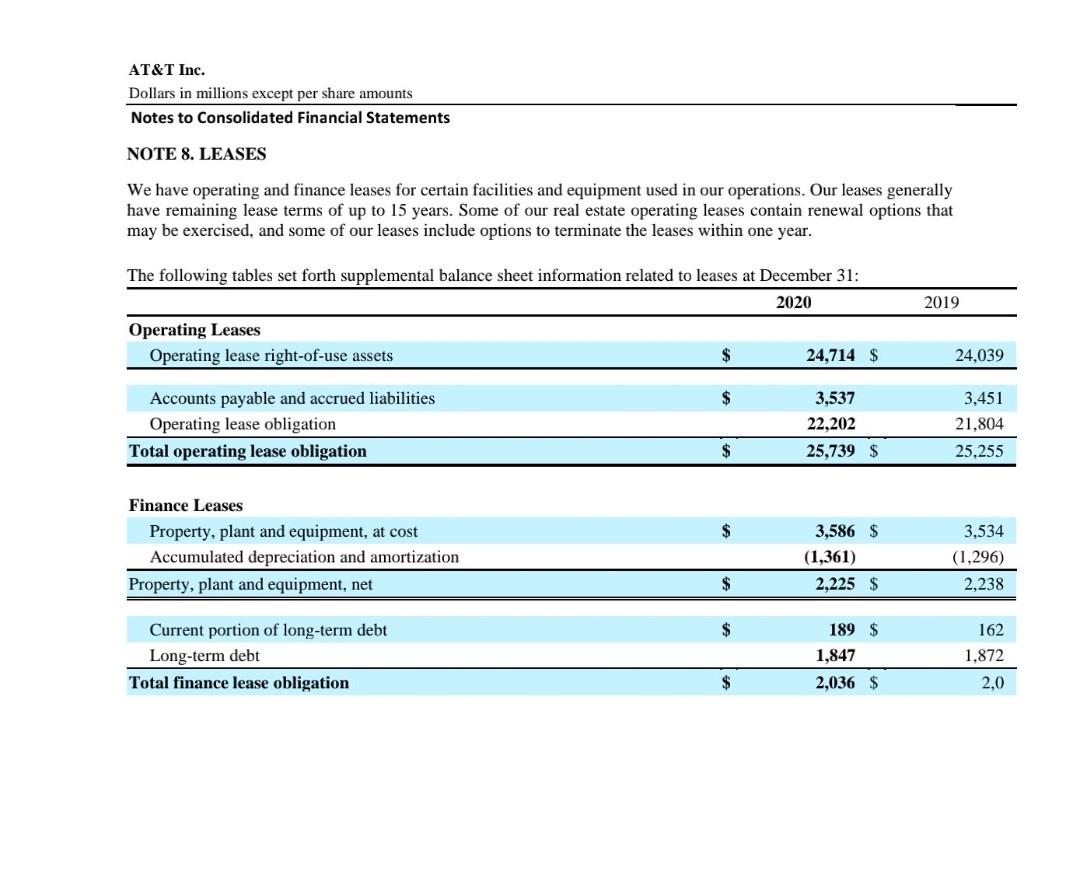
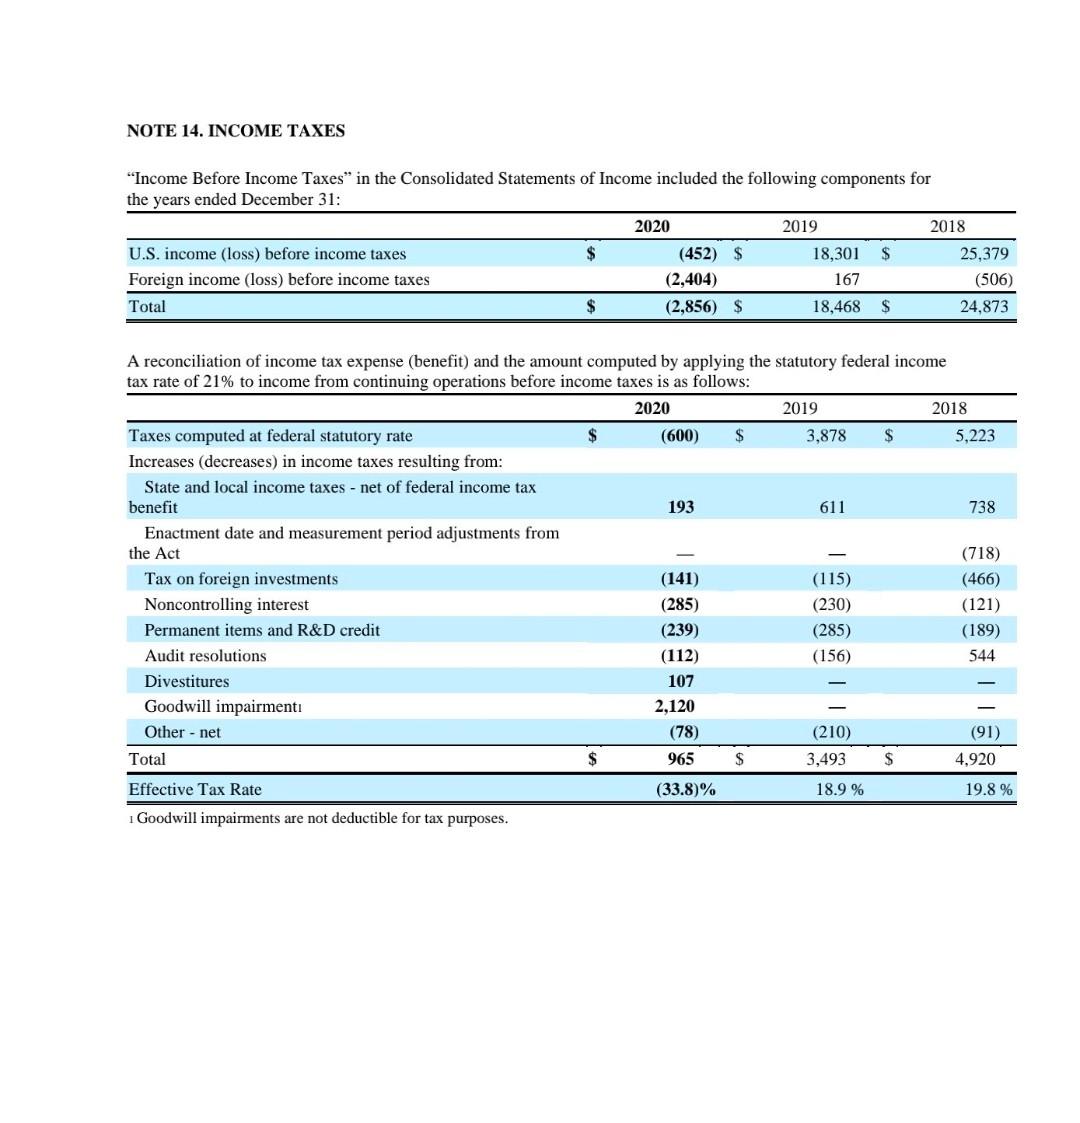
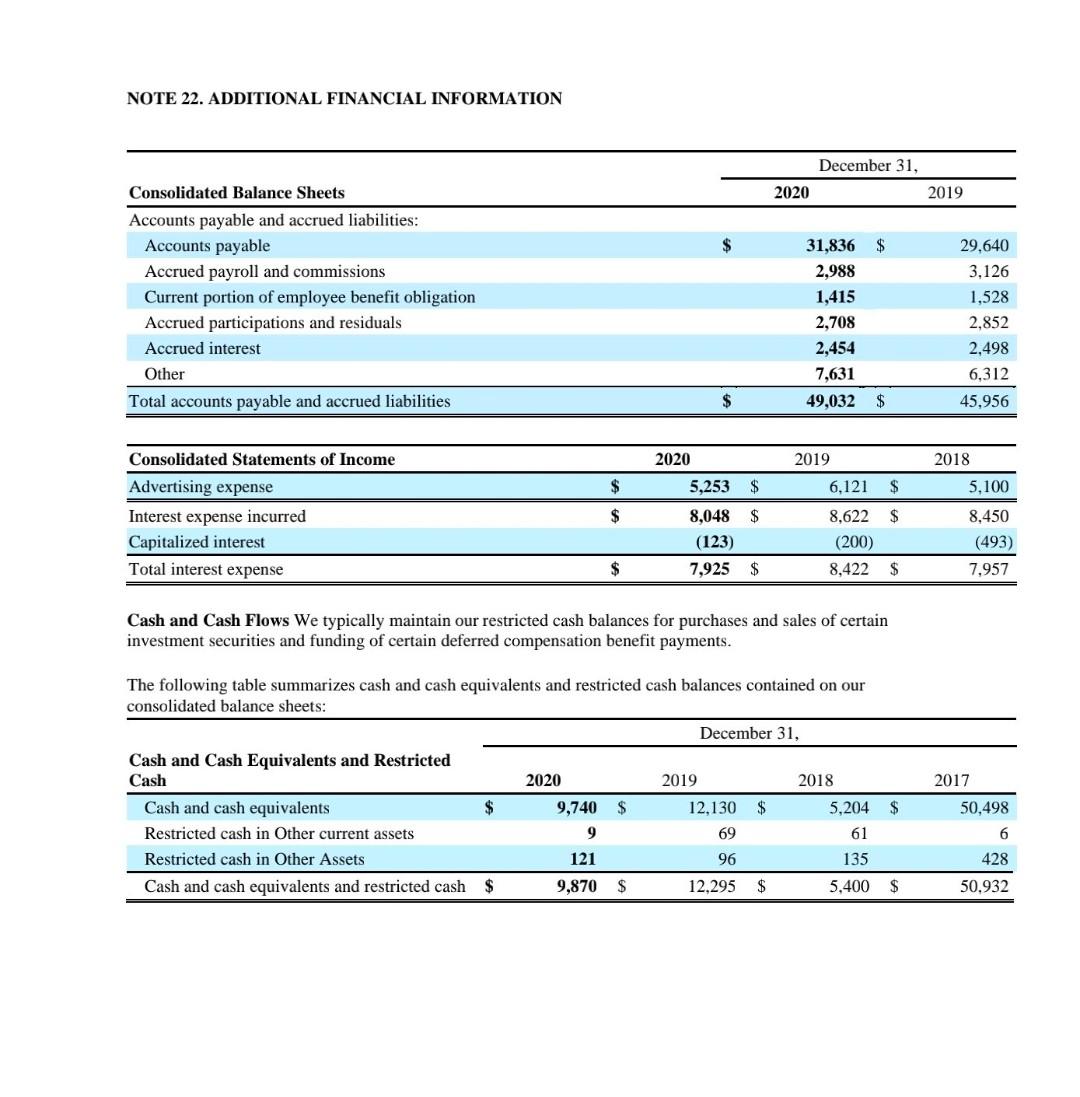
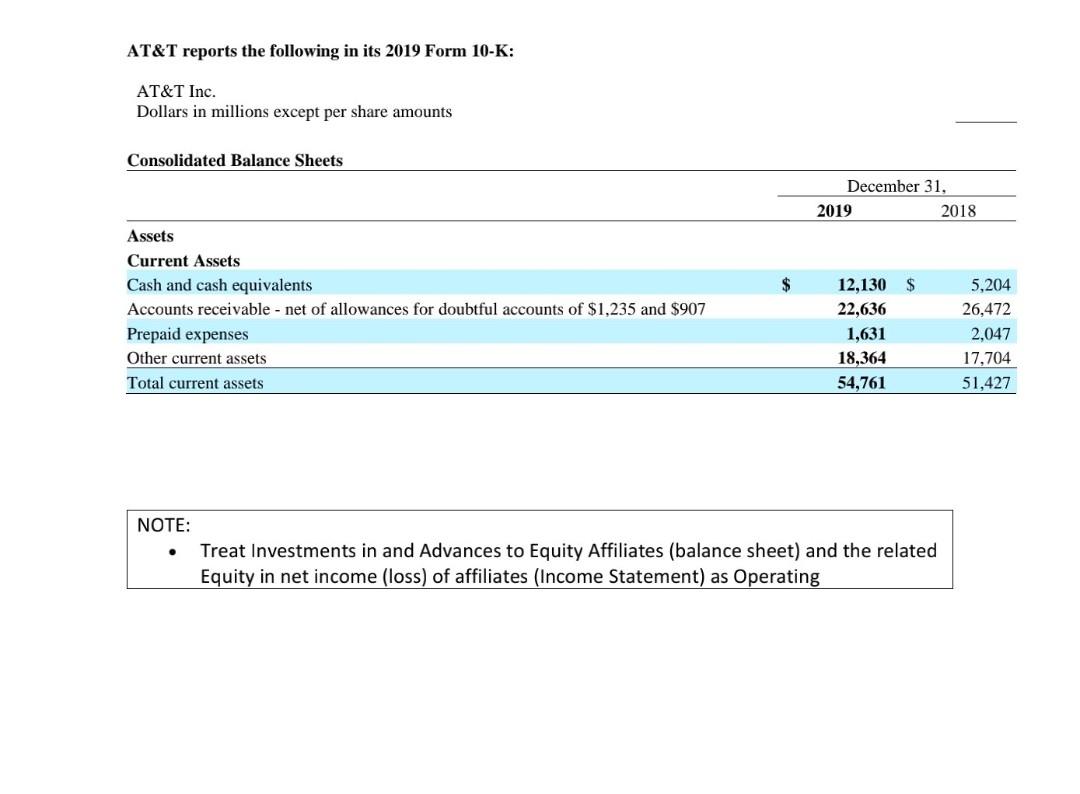
please do it in 10 minutes will upvote
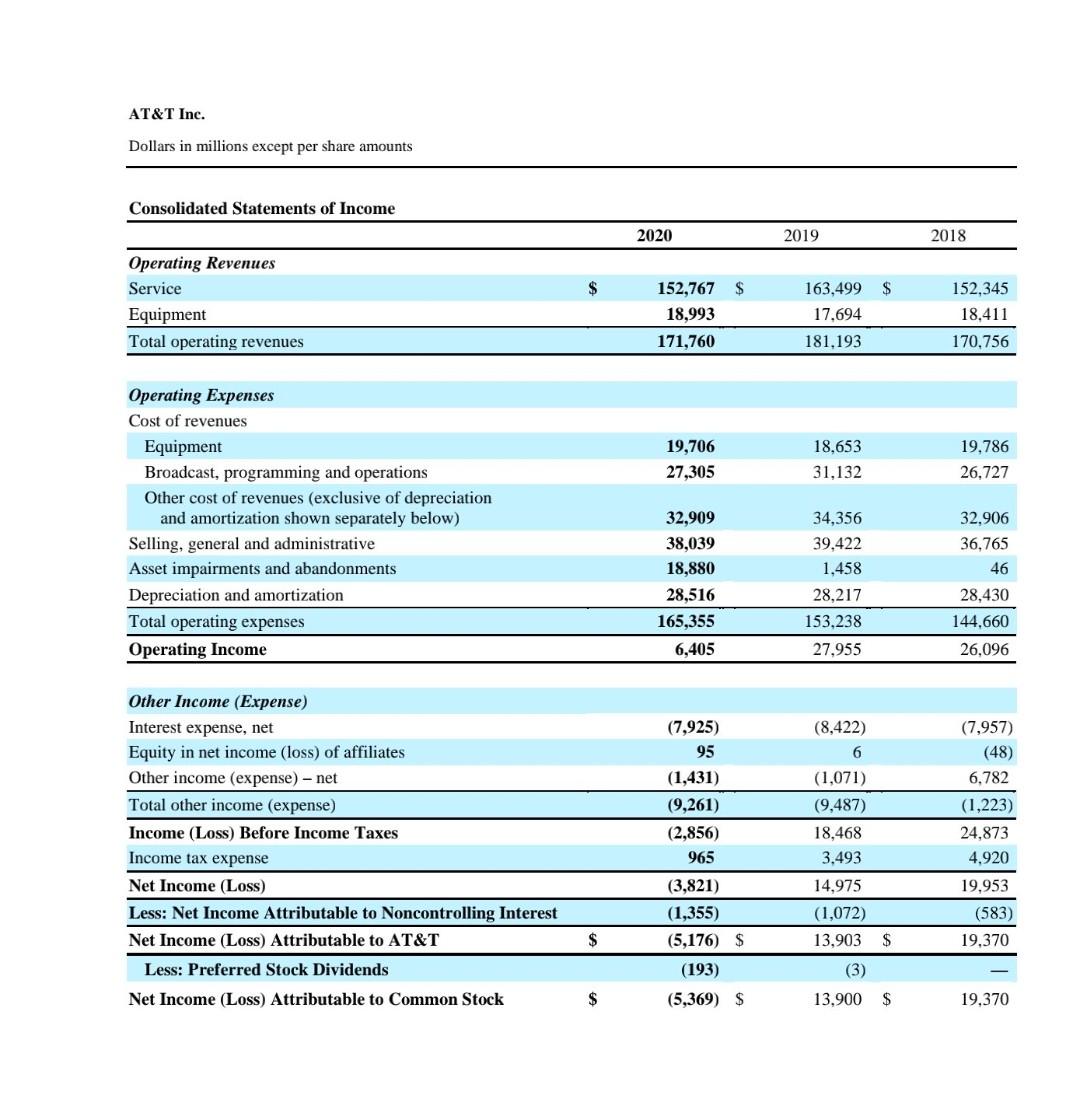
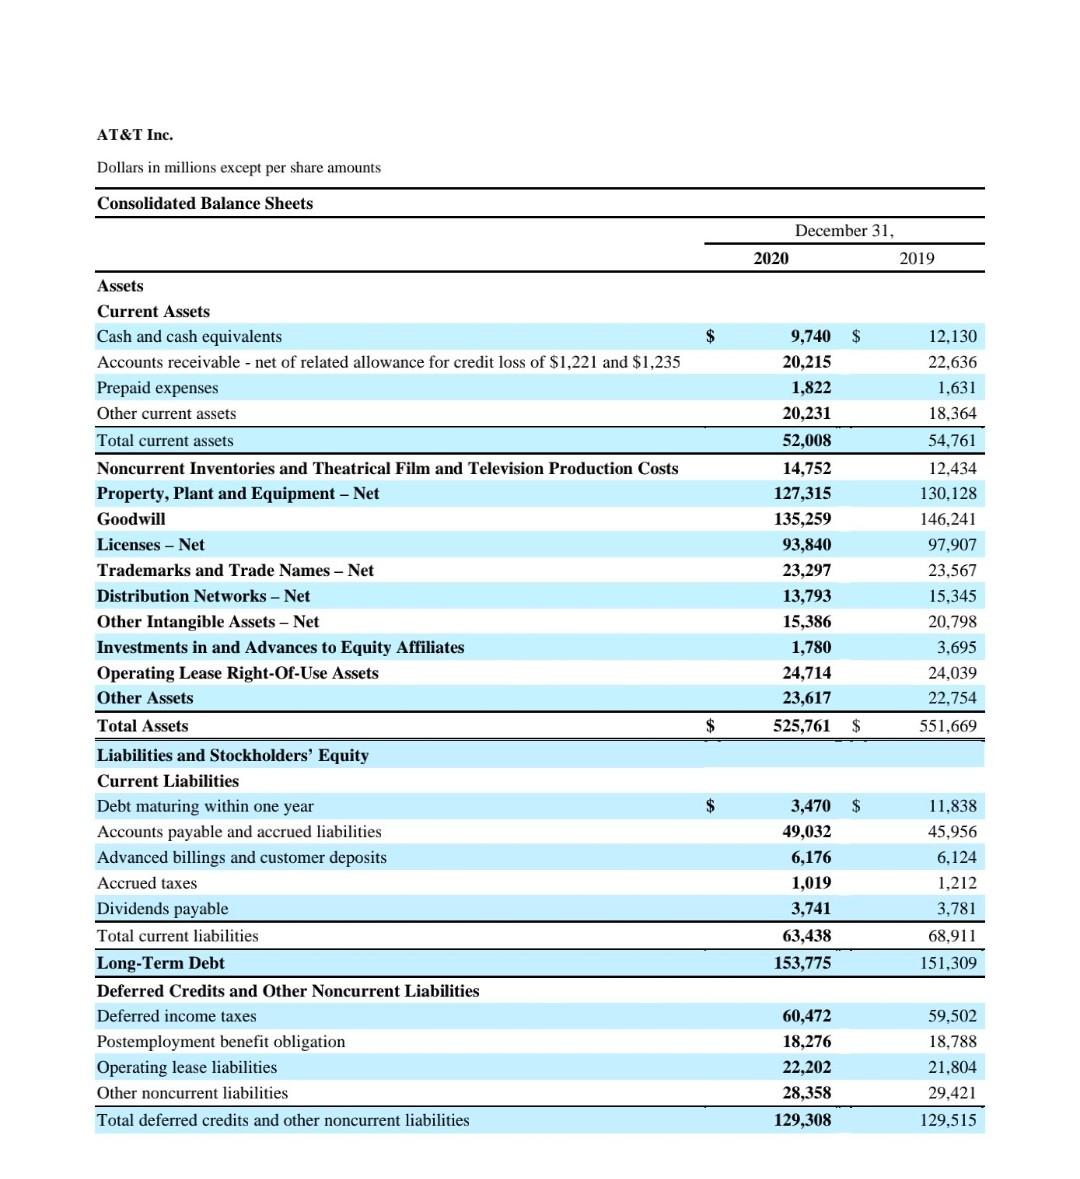
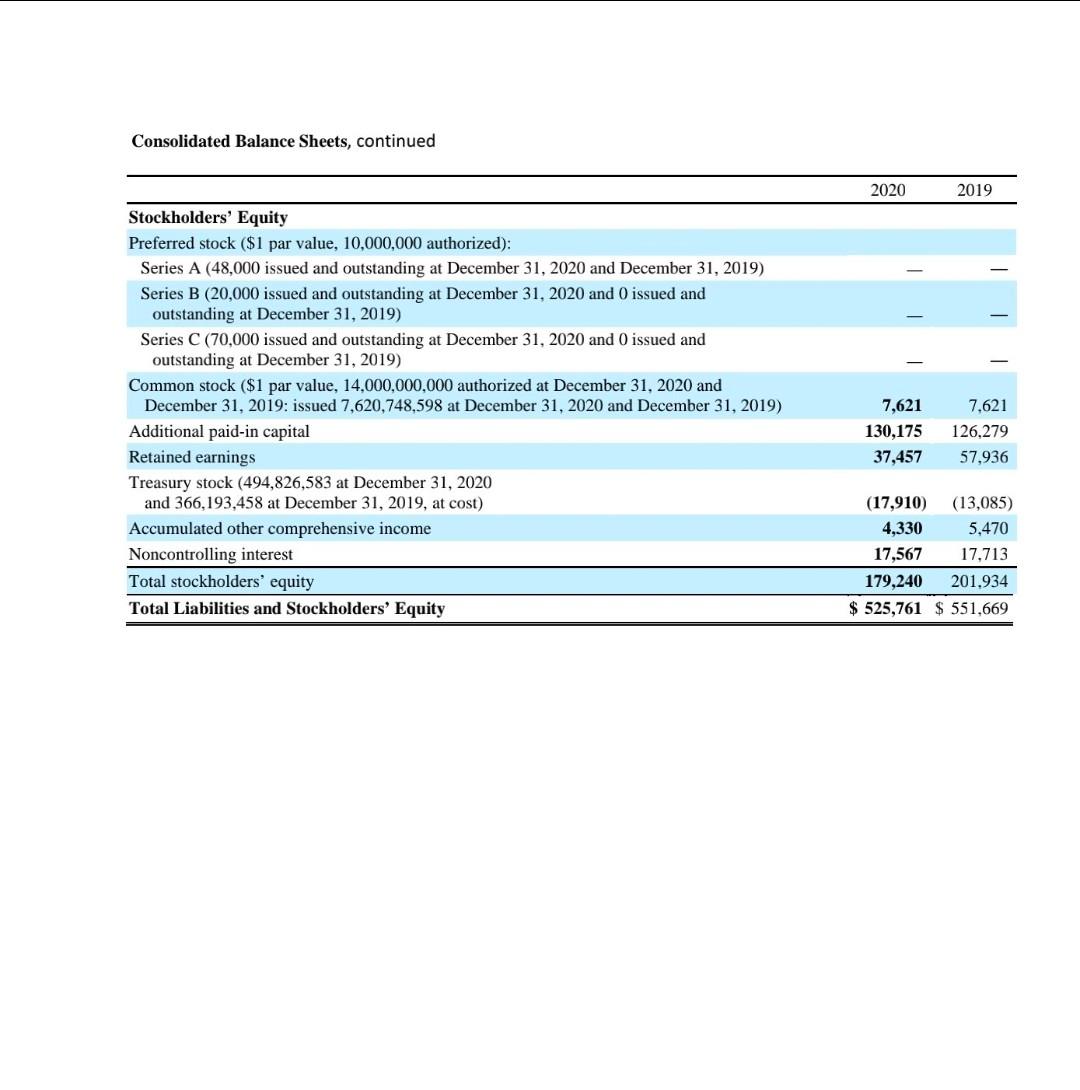
Question 7 3 pts In comparing AT&T's DSO in 2020 to 2019 which statement is accurate? AT&T's collection period deteriorated: DSO was lower in 2020 than in 2019 O AT&T's collection period improved: DSO was lower in 2020 than in 2019 O AT&T's collection period deteriorated: DSO was higher in 2020 than in 2019 O AT&T's collection period improved: DSO was higher in 2020 than in 2019 O Unable to determine based on information provided Question 8 3 pts Which year is AT&T better able to pay interest out of its current profits, based on the Time Interest Earned and EBITDA Coverage ratios? O Unable to determine from the information provided O 2020 O 2019 AT&T Inc. Dollars in millions except per share amounts Consolidated Statements of Income Operating Revenues Service Equipment Total operating revenues Operating Expenses Cost of revenues Equipment Broadcast, programming and operations Other cost of revenues (exclusive of depreciation and amortization shown separately below) Selling, general and administrative Asset impairments and abandonments Depreciation and amortization Total operating expenses Operating Income Other Income (Expense) Interest expense, net Equity in net income (loss) of affiliates Other income (expense) - net Total other income (expense) Income (Loss) Before Income Taxes Income tax expense Net Income (Loss) Less: Net Income Attributable to Noncontrolling Interest Net Income (Loss) Attributable to AT&T $ Less: Preferred Stock Dividends Net Income (Loss) Attributable to Common Stock $ $ 2020 152,767 18,993 171,760 19,706 27,305 32,909 38,039 18,880 28,516 165,355 6,405 (7,925) 95 (1,431) (9,261) (2,856) 965 (3,821) (1,355) (5,176) $ (193) (5,369) S 2019 163,499 $ 17,694 181,193 18,653 31,132 34,356 39,422 1,458 28,217 153,238 27,955 (8,422) 6 (1,071) (9,487) 18,468 3,493 14,975 (1,072) 13,903 $ (3) 13,900 $ 2018 152,345 18,411 170,756 19,786 26,727 32,906 36,765 46 28,430 144,660 26,096 (7,957) (48) 6,782 (1,223) 24,873 4,920 19,953 (583) 19,370 19,370 AT&T Inc. Dollars in millions except per share amounts Consolidated Balance Sheets Assets Current Assets Cash and cash equivalents $ Accounts receivable - net of related allowance for credit loss of $1,221 and $1,235 Prepaid expenses Other current assets Total current assets Noncurrent Inventories and Theatrical Film and Television Production Costs Property, Plant and Equipment - Net Goodwill Licenses - Net Trademarks and Trade Names - Net Distribution Networks - Net Other Intangible Assets - Net Investments in and Advances to Equity Affiliates Operating Lease Right-Of-Use Assets Other Assets Total Assets Liabilities and Stockholders' Equity Current Liabilities Debt maturing within one year Accounts payable and accrued liabilities Advanced billings and customer deposits Accrued taxes Dividends payable Total current liabilities Long-Term Debt Deferred Credits and Other Noncurrent Liabilities Deferred income taxes Postemployment benefit obligation Operating lease liabilities Other noncurrent liabilities Total deferred credits and other noncurrent liabilities $ $ 2020 December 31, 9,740 $ 20,215 1,822 20,231 52,008 14,752 127,315 135,259 93,840 23,297 13,793 15,386 1,780 24,714 23,617 525,761 $ 3,470 $ 49,032 6,176 1,019 3,741 63,438 153,775 60,472 18,276 22,202 28,358 129,308 2019 12,130 22,636 1,631 18,364 54,761 12,434 130,128 146,241 97,907 23,567 15,345 20,798 3,695 24,039 22,754 551,669 11,838 45,956 6,124 1,212 3,781 68,911 151,309 59,502 18,788 21,804 29,421 129,515 Consolidated Balance Sheets, continued Stockholders' Equity Preferred stock ($1 par value, 10,000,000 authorized): Series A (48,000 issued and outstanding at December 31, 2020 and December 31, 2019) Series B (20,000 issued and outstanding at December 31, 2020 and 0 issued and outstanding at December 31, 2019) Series C (70,000 issued and outstanding at December 31, 2020 and 0 issued and outstanding at December 31, 2019) Common stock ($1 par value, 14,000,000,000 authorized at December 31, 2020 and December 31, 2019: issued 7,620,748,598 at December 31, 2020 and December 31, 2019) Additional paid-in capital Retained earnings Treasury stock (494,826,583 at December 31, 2020 and 366,193,458 at December 31, 2019, at cost) Accumulated other comprehensive income Noncontrolling interest Total stockholders' equity Total Liabilities and Stockholders' Equity 2020 2019 7,621 7,621 130,175 126,279 37,457 57,936 (17,910) (13,085) 4,330 5.470 17,567 17,713 179,240 201,934 $ 525,761 $551,669 AT&T Inc. Dollars in millions except per share amounts Consolidated Statements of Cash Flows Operating Activities Net income (loss) Adjustments to reconcile net income (loss) to net cash provided by operating activities: Depreciation and amortization Amortization of film and television costs Undistributed earnings from investments in equity affiliates Provision for uncollectible accounts Deferred income tax expense Net (gain) loss on investments, net of impairments Pension and postretirement benefit expense (credit) Actuarial (gain) loss on pension and postretirement benefits Asset impairments and abandonments Changes in operating assets and liabilities: Receivables Other current assets, inventories and theatrical film and television production costs Accounts payable and other accrued liabilities Equipment installment receivables and related sales Deferred customer contract acquisition and fulfillment costs Postretirement claims and contributions Other - net Total adjustments Net Cash Provided by Operating Activities Investing Activities Capital expenditures, including $(123), $(200) and $(493) of interest during construction Acquisitions, net of cash acquired Dispositions (Purchases), sales and settlement of securities and investments, net Advances to and investments in equity affiliates, net Cash collections of deferred purchase price Net Cash Used in Investing Activities 2020 (3,821) $ 28,516 8,603 38 1,972 1,675 (742) (2,992) 4,169 18,880 2,216 (13,070) (1,410) (1,429) 376 (985) 1,134 46,951 43,130 (15,675) (1,851) 3,641 497 (160) (13,548) 2019 14,975 28,217 9,587 295 2,575 1,806 (1,218) (2,002) 5,171 1,458 2,812 (12,852) (1,524) 548 (910) (1,008) 738 33,693 48,668 (19,635) (1,809) 4,684 435 (365) (16,690) $ 2018 19,953 28,430 3,772 292 1,791 4,931 (739) (1,148) (3,412) 46 (1,580) (6,442) 1,602 (490) (3,458) (936) 990 23,649 43,602 (21,251) (43,309) 2,148 (183) (1,050) 500 (63,145) Consolidated Statements of Cash Flows, continued Financing Activities Net change in short-term borrowings with original maturities of three months or less Issuance of other short-term borrowings Repayment of other short-term borrowings Issuance of long-term debt Repayment of long-term debt Payment of vendor financing Issuance of preferred stock Purchase of treasury stock Issuan of treasury Issuance of preferred interests in subsidiaries Redemption of preferred interest in subsidiary Dividends paid Other - net Net Cash Used in Financing Activities Net (decrease) increase in cash and cash equivalents and restricted cash Cash and cash equivalents and restricted cash beginning of year Cash and Cash Equivalents and Restricted Cash End of Year $ 2020 2019 (17) 9,440 4,012 (9,467) (6,904) 31,988 17,039 (39,964) (27,592) (2,966) (3,050) 3,869 1,164 (5,498) (2,417) 631 1,979 7,876 (1,950) (14,956) (14,888) (4,570) (678) (32,007) (25,083) (2,425) 6,895 12,295 5,400 12,295 $ 9,870 S (276) 2018 (821) 4,898 (2,098) 41,875 (52,643) (560) (609) 745 (13,410) (3,366) (25,989) (45,532) 50,932 5,400 AT&T Inc. Dollars in millions except per share amounts Notes to Consolidated Financial Statements NOTE 8. LEASES We have operating and finance leases for certain facilities and equipment used in our operations. Our leases generally have remaining lease terms of up to 15 years. Some of our real estate operating leases contain renewal options that may be exercised, and some of our leases include options to terminate the leases within one year. The following tables set forth supplemental balance sheet information related to leases at December 31: 2020 2019 Operating Leases Operating lease right-of-use assets $ 24,714 $ Accounts payable and accrued liabilities $ 3,537 Operating lease obligation 22,202 Total operating lease obligation $ 25,739 $ Finance Leases Property, plant and equipment, at cost $ 3,586 $ Accumulated depreciation and amortization Property, plant and equipment, net $ 2,225 $ Current portion of long-term debt $ 189 $ Long-term debt 1,847 Total finance lease obligation $ 2,036 $ (1,361) 24,039 3,451 21,804 25,255 3.534 (1,296) 2,238 162 1,872 2,0 NOTE 14. INCOME TAXES "Income Before Income Taxes" in the Consolidated Statements of Income included the following components for the years ended December 31: 2020 2019 2018 U.S. income (loss) before income taxes $ 25,379 (452) $ (2,404) (2,856) $ Foreign income (loss) before income taxes Total 18,301 $ 167 18,468 $ (506) $ 24,873 A reconciliation of income tax expense (benefit) and the amount computed by applying the statutory federal income tax rate of 21% to income from continuing operations before income taxes is as follows: 2020 2019 2018 Taxes computed at federal statutory rate $ (600) $ 3,878 $ Increases (decreases) in income taxes resulting from: State and local income taxes - net of federal income tax benefit 193 611 Enactment date and measurement period adjustments from the Act - - Tax on foreign investments (141) (115) Noncontrolling interest (285) (230) Permanent items and R&D credit (239) (285) Audit resolutions. (112) (156) Divestitures 107 Goodwill impairmenti 2,120 Other - net (78) (210) Total 965 3,493 Effective Tax Rate (33.8)% 1 Goodwill impairments are not deductible for tax purposes. $ $ 18.9 % $ 5,223 738 (718) (466) (121) (189) 544 (91) 4,920 19.8 % NOTE 22. ADDITIONAL FINANCIAL INFORMATION Consolidated Balance Sheets Accounts payable and accrued liabilities: Accounts payable Accrued payroll and commissions Current portion of employee benefit obligation Accrued participations and residuals Accrued interest Other Total accounts payable and accrued liabilities Consolidated Statements of Income Advertising expense $ 5,253 $ 6,121 $ Interest expense incurred $ 8,622 $ 8,048 $ (123) Capitalized interest (200) Total interest expense $ 7,925 $ 8,422 $ Cash and Cash Flows We typically maintain our restricted cash balances for purchases and sales of certain investment securities and funding of certain deferred compensation benefit payments. The following table summarizes cash and cash equivalents and restricted cash balances contained on our consolidated balance sheets: December 31, Cash and Cash Equivalents and Restricted Cash 2020 2019 Cash and cash equivalents $ Restricted cash in Other current assets 9,740 $ 9 121 Restricted cash in Other Assets Cash and cash equivalents and restricted cash $ 9,870 $ 2020 $ 12,130 $ 69 96 12,295 $ 2020 December 31, 31,836 $ 2,988 1,415 2,708 2,454 7,631 49,032 $ 2019 2018 5,204 61 135 5,400 $ $ 2019 29,640 3,126 1,528 2,852 2,498 6,312 45,956 5,100 8,450 2018 (493) 7,957 2017 50,498 6 428 50,932 AT&T reports the following in its 2019 Form 10-K: AT&T Inc. Dollars in millions except per share amounts Consolidated Balance Sheets Assets Current Assets Cash and cash equivalents 12,130 $ Accounts receivable - net of allowances for doubtful accounts of $1,235 and $907 22,636 Prepaid expenses 1,631 Other current assets. 18,364 Total current assets 54,761 NOTE: Treat Investments in and Advances to Equity Affiliates (balance sheet) and the related Equity in net income (loss) of affiliates (Income Statement) as Operating $ December 31, 2019 2018 5,204 26,472 2,047 17,704 51,427 Question 7 3 pts In comparing AT&T's DSO in 2020 to 2019 which statement is accurate? AT&T's collection period deteriorated: DSO was lower in 2020 than in 2019 O AT&T's collection period improved: DSO was lower in 2020 than in 2019 O AT&T's collection period deteriorated: DSO was higher in 2020 than in 2019 O AT&T's collection period improved: DSO was higher in 2020 than in 2019 O Unable to determine based on information provided Question 8 3 pts Which year is AT&T better able to pay interest out of its current profits, based on the Time Interest Earned and EBITDA Coverage ratios? O Unable to determine from the information provided O 2020 O 2019 AT&T Inc. Dollars in millions except per share amounts Consolidated Statements of Income Operating Revenues Service Equipment Total operating revenues Operating Expenses Cost of revenues Equipment Broadcast, programming and operations Other cost of revenues (exclusive of depreciation and amortization shown separately below) Selling, general and administrative Asset impairments and abandonments Depreciation and amortization Total operating expenses Operating Income Other Income (Expense) Interest expense, net Equity in net income (loss) of affiliates Other income (expense) - net Total other income (expense) Income (Loss) Before Income Taxes Income tax expense Net Income (Loss) Less: Net Income Attributable to Noncontrolling Interest Net Income (Loss) Attributable to AT&T $ Less: Preferred Stock Dividends Net Income (Loss) Attributable to Common Stock $ $ 2020 152,767 18,993 171,760 19,706 27,305 32,909 38,039 18,880 28,516 165,355 6,405 (7,925) 95 (1,431) (9,261) (2,856) 965 (3,821) (1,355) (5,176) $ (193) (5,369) S 2019 163,499 $ 17,694 181,193 18,653 31,132 34,356 39,422 1,458 28,217 153,238 27,955 (8,422) 6 (1,071) (9,487) 18,468 3,493 14,975 (1,072) 13,903 $ (3) 13,900 $ 2018 152,345 18,411 170,756 19,786 26,727 32,906 36,765 46 28,430 144,660 26,096 (7,957) (48) 6,782 (1,223) 24,873 4,920 19,953 (583) 19,370 19,370 AT&T Inc. Dollars in millions except per share amounts Consolidated Balance Sheets Assets Current Assets Cash and cash equivalents $ Accounts receivable - net of related allowance for credit loss of $1,221 and $1,235 Prepaid expenses Other current assets Total current assets Noncurrent Inventories and Theatrical Film and Television Production Costs Property, Plant and Equipment - Net Goodwill Licenses - Net Trademarks and Trade Names - Net Distribution Networks - Net Other Intangible Assets - Net Investments in and Advances to Equity Affiliates Operating Lease Right-Of-Use Assets Other Assets Total Assets Liabilities and Stockholders' Equity Current Liabilities Debt maturing within one year Accounts payable and accrued liabilities Advanced billings and customer deposits Accrued taxes Dividends payable Total current liabilities Long-Term Debt Deferred Credits and Other Noncurrent Liabilities Deferred income taxes Postemployment benefit obligation Operating lease liabilities Other noncurrent liabilities Total deferred credits and other noncurrent liabilities $ $ 2020 December 31, 9,740 $ 20,215 1,822 20,231 52,008 14,752 127,315 135,259 93,840 23,297 13,793 15,386 1,780 24,714 23,617 525,761 $ 3,470 $ 49,032 6,176 1,019 3,741 63,438 153,775 60,472 18,276 22,202 28,358 129,308 2019 12,130 22,636 1,631 18,364 54,761 12,434 130,128 146,241 97,907 23,567 15,345 20,798 3,695 24,039 22,754 551,669 11,838 45,956 6,124 1,212 3,781 68,911 151,309 59,502 18,788 21,804 29,421 129,515 Consolidated Balance Sheets, continued Stockholders' Equity Preferred stock ($1 par value, 10,000,000 authorized): Series A (48,000 issued and outstanding at December 31, 2020 and December 31, 2019) Series B (20,000 issued and outstanding at December 31, 2020 and 0 issued and outstanding at December 31, 2019) Series C (70,000 issued and outstanding at December 31, 2020 and 0 issued and outstanding at December 31, 2019) Common stock ($1 par value, 14,000,000,000 authorized at December 31, 2020 and December 31, 2019: issued 7,620,748,598 at December 31, 2020 and December 31, 2019) Additional paid-in capital Retained earnings Treasury stock (494,826,583 at December 31, 2020 and 366,193,458 at December 31, 2019, at cost) Accumulated other comprehensive income Noncontrolling interest Total stockholders' equity Total Liabilities and Stockholders' Equity 2020 2019 7,621 7,621 130,175 126,279 37,457 57,936 (17,910) (13,085) 4,330 5.470 17,567 17,713 179,240 201,934 $ 525,761 $551,669 AT&T Inc. Dollars in millions except per share amounts Consolidated Statements of Cash Flows Operating Activities Net income (loss) Adjustments to reconcile net income (loss) to net cash provided by operating activities: Depreciation and amortization Amortization of film and television costs Undistributed earnings from investments in equity affiliates Provision for uncollectible accounts Deferred income tax expense Net (gain) loss on investments, net of impairments Pension and postretirement benefit expense (credit) Actuarial (gain) loss on pension and postretirement benefits Asset impairments and abandonments Changes in operating assets and liabilities: Receivables Other current assets, inventories and theatrical film and television production costs Accounts payable and other accrued liabilities Equipment installment receivables and related sales Deferred customer contract acquisition and fulfillment costs Postretirement claims and contributions Other - net Total adjustments Net Cash Provided by Operating Activities Investing Activities Capital expenditures, including $(123), $(200) and $(493) of interest during construction Acquisitions, net of cash acquired Dispositions (Purchases), sales and settlement of securities and investments, net Advances to and investments in equity affiliates, net Cash collections of deferred purchase price Net Cash Used in Investing Activities 2020 (3,821) $ 28,516 8,603 38 1,972 1,675 (742) (2,992) 4,169 18,880 2,216 (13,070) (1,410) (1,429) 376 (985) 1,134 46,951 43,130 (15,675) (1,851) 3,641 497 (160) (13,548) 2019 14,975 28,217 9,587 295 2,575 1,806 (1,218) (2,002) 5,171 1,458 2,812 (12,852) (1,524) 548 (910) (1,008) 738 33,693 48,668 (19,635) (1,809) 4,684 435 (365) (16,690) $ 2018 19,953 28,430 3,772 292 1,791 4,931 (739) (1,148) (3,412) 46 (1,580) (6,442) 1,602 (490) (3,458) (936) 990 23,649 43,602 (21,251) (43,309) 2,148 (183) (1,050) 500 (63,145) Consolidated Statements of Cash Flows, continued Financing Activities Net change in short-term borrowings with original maturities of three months or less Issuance of other short-term borrowings Repayment of other short-term borrowings Issuance of long-term debt Repayment of long-term debt Payment of vendor financing Issuance of preferred stock Purchase of treasury stock Issuan of treasury Issuance of preferred interests in subsidiaries Redemption of preferred interest in subsidiary Dividends paid Other - net Net Cash Used in Financing Activities Net (decrease) increase in cash and cash equivalents and restricted cash Cash and cash equivalents and restricted cash beginning of year Cash and Cash Equivalents and Restricted Cash End of Year $ 2020 2019 (17) 9,440 4,012 (9,467) (6,904) 31,988 17,039 (39,964) (27,592) (2,966) (3,050) 3,869 1,164 (5,498) (2,417) 631 1,979 7,876 (1,950) (14,956) (14,888) (4,570) (678) (32,007) (25,083) (2,425) 6,895 12,295 5,400 12,295 $ 9,870 S (276) 2018 (821) 4,898 (2,098) 41,875 (52,643) (560) (609) 745 (13,410) (3,366) (25,989) (45,532) 50,932 5,400 AT&T Inc. Dollars in millions except per share amounts Notes to Consolidated Financial Statements NOTE 8. LEASES We have operating and finance leases for certain facilities and equipment used in our operations. Our leases generally have remaining lease terms of up to 15 years. Some of our real estate operating leases contain renewal options that may be exercised, and some of our leases include options to terminate the leases within one year. The following tables set forth supplemental balance sheet information related to leases at December 31: 2020 2019 Operating Leases Operating lease right-of-use assets $ 24,714 $ Accounts payable and accrued liabilities $ 3,537 Operating lease obligation 22,202 Total operating lease obligation $ 25,739 $ Finance Leases Property, plant and equipment, at cost $ 3,586 $ Accumulated depreciation and amortization Property, plant and equipment, net $ 2,225 $ Current portion of long-term debt $ 189 $ Long-term debt 1,847 Total finance lease obligation $ 2,036 $ (1,361) 24,039 3,451 21,804 25,255 3.534 (1,296) 2,238 162 1,872 2,0 NOTE 14. INCOME TAXES "Income Before Income Taxes" in the Consolidated Statements of Income included the following components for the years ended December 31: 2020 2019 2018 U.S. income (loss) before income taxes $ 25,379 (452) $ (2,404) (2,856) $ Foreign income (loss) before income taxes Total 18,301 $ 167 18,468 $ (506) $ 24,873 A reconciliation of income tax expense (benefit) and the amount computed by applying the statutory federal income tax rate of 21% to income from continuing operations before income taxes is as follows: 2020 2019 2018 Taxes computed at federal statutory rate $ (600) $ 3,878 $ Increases (decreases) in income taxes resulting from: State and local income taxes - net of federal income tax benefit 193 611 Enactment date and measurement period adjustments from the Act - - Tax on foreign investments (141) (115) Noncontrolling interest (285) (230) Permanent items and R&D credit (239) (285) Audit resolutions. (112) (156) Divestitures 107 Goodwill impairmenti 2,120 Other - net (78) (210) Total 965 3,493 Effective Tax Rate (33.8)% 1 Goodwill impairments are not deductible for tax purposes. $ $ 18.9 % $ 5,223 738 (718) (466) (121) (189) 544 (91) 4,920 19.8 % NOTE 22. ADDITIONAL FINANCIAL INFORMATION Consolidated Balance Sheets Accounts payable and accrued liabilities: Accounts payable Accrued payroll and commissions Current portion of employee benefit obligation Accrued participations and residuals Accrued interest Other Total accounts payable and accrued liabilities Consolidated Statements of Income Advertising expense $ 5,253 $ 6,121 $ Interest expense incurred $ 8,622 $ 8,048 $ (123) Capitalized interest (200) Total interest expense $ 7,925 $ 8,422 $ Cash and Cash Flows We typically maintain our restricted cash balances for purchases and sales of certain investment securities and funding of certain deferred compensation benefit payments. The following table summarizes cash and cash equivalents and restricted cash balances contained on our consolidated balance sheets: December 31, Cash and Cash Equivalents and Restricted Cash 2020 2019 Cash and cash equivalents $ Restricted cash in Other current assets 9,740 $ 9 121 Restricted cash in Other Assets Cash and cash equivalents and restricted cash $ 9,870 $ 2020 $ 12,130 $ 69 96 12,295 $ 2020 December 31, 31,836 $ 2,988 1,415 2,708 2,454 7,631 49,032 $ 2019 2018 5,204 61 135 5,400 $ $ 2019 29,640 3,126 1,528 2,852 2,498 6,312 45,956 5,100 8,450 2018 (493) 7,957 2017 50,498 6 428 50,932 AT&T reports the following in its 2019 Form 10-K: AT&T Inc. Dollars in millions except per share amounts Consolidated Balance Sheets Assets Current Assets Cash and cash equivalents 12,130 $ Accounts receivable - net of allowances for doubtful accounts of $1,235 and $907 22,636 Prepaid expenses 1,631 Other current assets. 18,364 Total current assets 54,761 NOTE: Treat Investments in and Advances to Equity Affiliates (balance sheet) and the related Equity in net income (loss) of affiliates (Income Statement) as Operating $ December 31, 2019 2018 5,204 26,472 2,047 17,704 51,427Step by Step Solution
There are 3 Steps involved in it
Step: 1

Get Instant Access to Expert-Tailored Solutions
See step-by-step solutions with expert insights and AI powered tools for academic success
Step: 2

Step: 3

Ace Your Homework with AI
Get the answers you need in no time with our AI-driven, step-by-step assistance
Get Started


