 please do not answer the question in a paper or a table
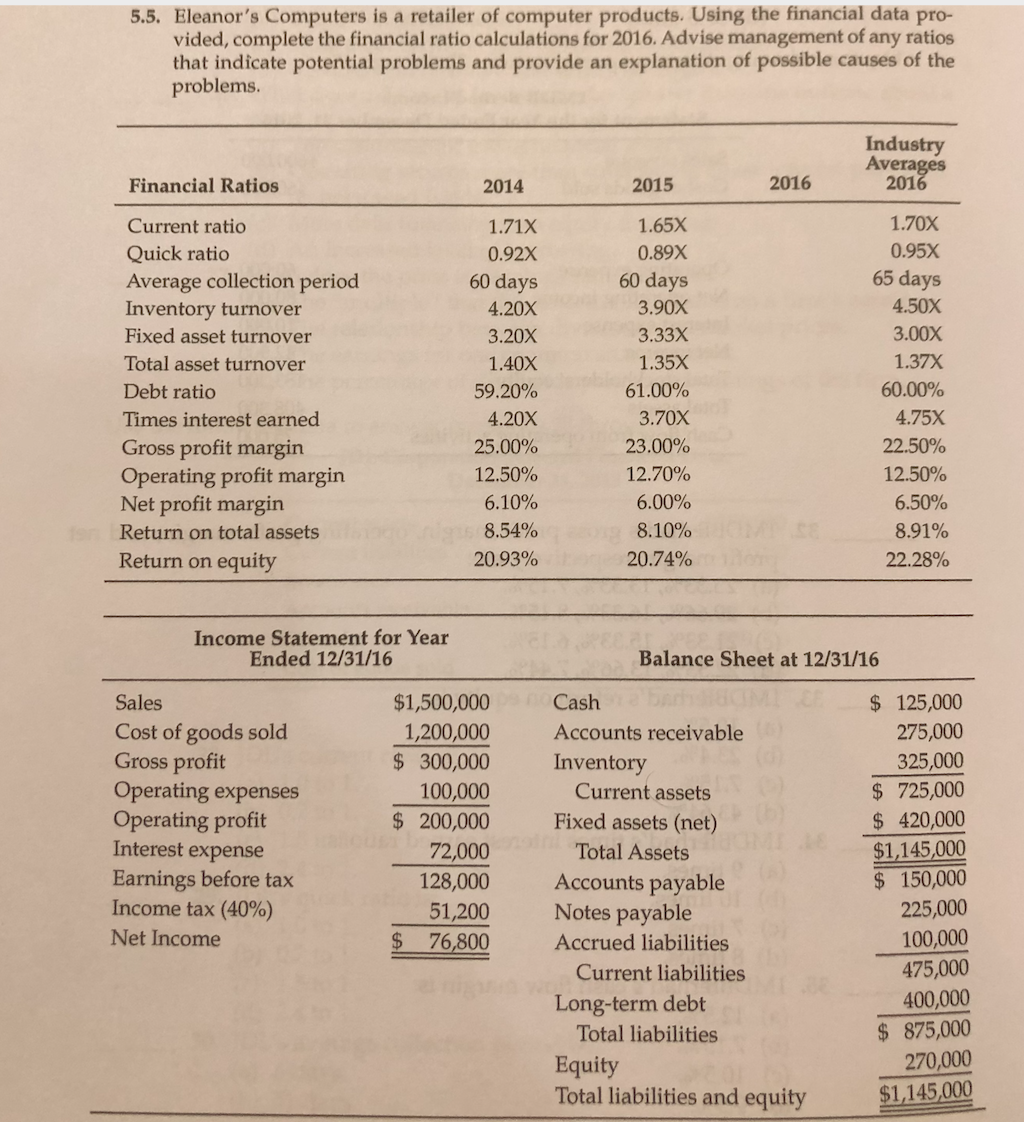
5.5. Eleanor's Computers is a retailer of computer products. Using the financial data pro- vided, complete the financial ratio calculations for 2016. Advise management of any ratios that indicate potential problems and provide an explanation of possible causes of the problems. Industry Averages 2016 Financial Ratios 2014 2015 2016 Current ratio Quick ratio Average collection period Inventory turnover Fixed asset turnover Total asset turnover Debt ratio Times interest earned Gross profit margin Operating profit margin Net profit margin Return on total assets Return on equity 1.71x 0.92X 60 days 4.20x 3.20x 1.40X 59.20% 4.20X 25.00% 12.50% 6.10% 8.54% 20.93% 1.65X 0.89X 60 days 3.90X 3.33% 1.35X 61.00% 3.70X 23.00% 12.70% 6.00% 8.10% 20.74% 1.70X 0.95X 65 days 4.50X 3.00X 1.37X 60.00% 4.75X 22.50% 12.50% 6.50% 8.91% 22.28% Income Statement for Year Ended 12/31/16 Balance Sheet at 12/31/16 Sales Cost of goods sold Gross profit Operating expenses Operating profit Interest expense Earnings before tax Income tax (40%) Net Income $1,500,000 1,200,000 $ 300,000 100,000 $ 200,000 72,000 128,000 51,200 $ 76,800 Cash Accounts receivable Inventory Current assets Fixed assets (net) Total Assets Accounts payable Notes payable Accrued liabilities Current liabilities Long-term debt Total liabilities Equity Total liabilities and equity $ 125,000 275,000 325,000 $ 725,000 $ 420,000 $1,145,000 $ 150,000 225,000 100,000 475,000 400,000 $ 875,000 270,000 $1,145,000 5.5. Eleanor's Computers is a retailer of computer products. Using the financial data pro- vided, complete the financial ratio calculations for 2016. Advise management of any ratios that indicate potential problems and provide an explanation of possible causes of the problems. Industry Averages 2016 Financial Ratios 2014 2015 2016 Current ratio Quick ratio Average collection period Inventory turnover Fixed asset turnover Total asset turnover Debt ratio Times interest earned Gross profit margin Operating profit margin Net profit margin Return on total assets Return on equity 1.71x 0.92X 60 days 4.20x 3.20x 1.40X 59.20% 4.20X 25.00% 12.50% 6.10% 8.54% 20.93% 1.65X 0.89X 60 days 3.90X 3.33% 1.35X 61.00% 3.70X 23.00% 12.70% 6.00% 8.10% 20.74% 1.70X 0.95X 65 days 4.50X 3.00X 1.37X 60.00% 4.75X 22.50% 12.50% 6.50% 8.91% 22.28% Income Statement for Year Ended 12/31/16 Balance Sheet at 12/31/16 Sales Cost of goods sold Gross profit Operating expenses Operating profit Interest expense Earnings before tax Income tax (40%) Net Income $1,500,000 1,200,000 $ 300,000 100,000 $ 200,000 72,000 128,000 51,200 $ 76,800 Cash Accounts receivable Inventory Current assets Fixed assets (net) Total Assets Accounts payable Notes payable Accrued liabilities Current liabilities Long-term debt Total liabilities Equity Total liabilities and equity $ 125,000 275,000 325,000 $ 725,000 $ 420,000 $1,145,000 $ 150,000 225,000 100,000 475,000 400,000 $ 875,000 270,000 $1,145,000
 please do not answer the question in a paper or a table


