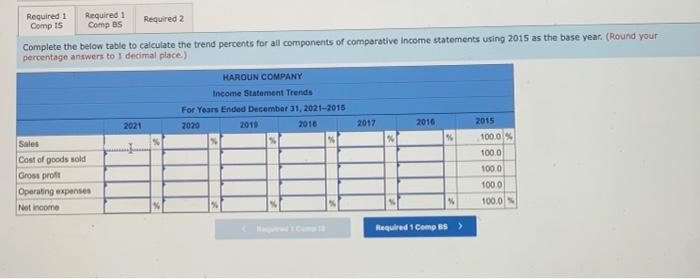
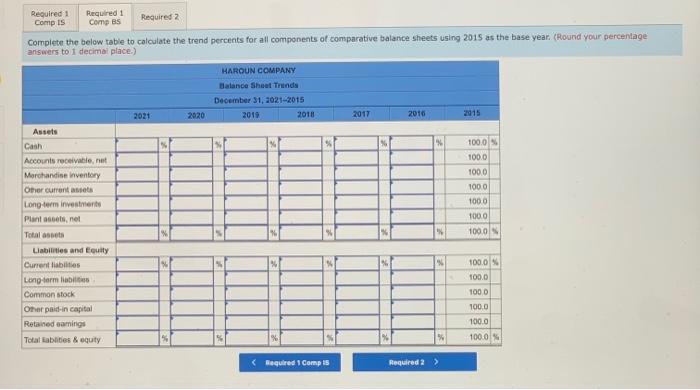
please do required 1 comp IS & required 1 comp BS
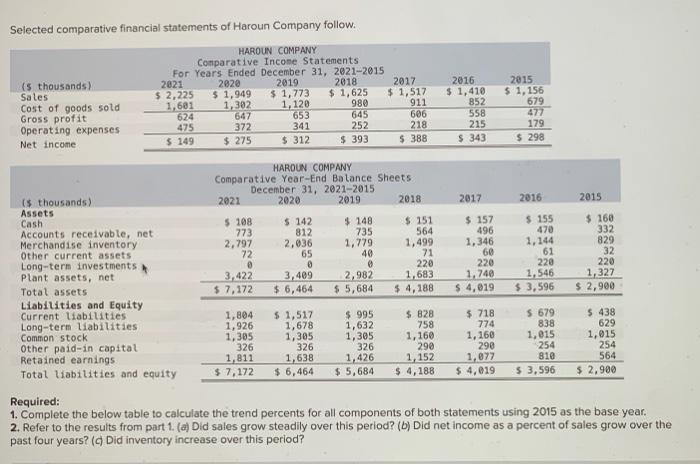
Selected comparative financial statements of Haroun Company follow. 2021 is thousands) Sales Cost of goods sold Gross profit Operating expenses Net income HAROUN COMPANY Comparative Income Statements For Years Ended December 31, 2021-2015 2020 2019 2018 2017 $ 2,225 $ 1,949 $ 1,773 $ 1,625 $ 1,517 1,601 1, 382 1,120 980 911 624 647 653 645 606 475 372 341 252 218 $ 149 $ 275 $ 312 $ 393 $ 388 2015 $ 1,156 679 2016 $ 1,410 852 558 215 $ 343 179 $ 298 2017 2016 2015 is thousands) Assets Cash Accounts receivable, net Merchandise inventory Other current assets Long-term investments Plant assets, net Total assets Liabilities and Equity Current liabilities Long-term liabilities Common stock Other paid-in capital Retained earnings Total liabilities and equity HAROUN COMPANY Comparative Year-End Balance Sheets December 31, 2021-2015 2021 2020 2019 2018 $ 108 $ 142 $ 148 $ 151 773 812 735 564 2,797 2,036 1,779 1,499 72 65 40 71 0 0 220 3,422 3,499 2,982 1,683 $ 7,172 $ 6,464 $ 5,684 $ 4,188 $ 157 496 1,346 60 220 1.740 $ 4,019 $ 155 470 1.144 61 220 1,546 $ 3,596 $ 160 332 829 32 220 1,327 $ 2,900 1,804 1,926 1,305 326 1,811 $ 7,172 $ 1,517 1,678 1,305 326 1,638 $ 6,464 $ 995 1,632 1,305 326 1,426 $ 5,684 $ 828 758 1,160 290 1,152 $ 4,188 $ 718 774 1,160 290 1,077 $ 4,019 $ 679 838 1,015 254 810 $ 3,596 $ 438 629 1,015 254 564 $ 2.900 Required: 1. Complete the below table to calculate the trend percents for all components of both statements using 2015 as the base year. 2. Refer to the results from part 1. (a} Did sales grow steadily over this period? (6) Did net income as a percent of sales grow over the past four years? (Did inventory increase over this period? Required 1 Required 1 Comp Is Comp es Required 2 Complete the below table to calculate the trend percents for all components of comparative Income statements using 2015 as the base year. (Round your percentage answers to 1 decimal place.) HAROUN COMPANY Income Statement Trends For Years Ended December 31, 2021-2015 2020 2011 2021 2010 2017 2016 * Sales Cost of goods sold Gross profit Operating expenses Not income 2015 100.0% 100.0 100.0 100.0 100.0 Required 1 Comp s> Required 1 Comp IS Required 1 Como es Required 2 Complete the below table to calculate the trend percents for all components of comparative balance sheets using 2015 as the base year. (Round your percentage answers to 1 decimai place.) HAROUN COMPANY Balance Sheet Trends December 31, 2021-2015 2010 2018 2021 2020 2017 2016 2015 1000 100.0 1000 1000 1000 1000 100.0 Assets Cash Accounts receivable net Merchandise inventory Other current Long-term investment Plantas, nel Total Liabilities and Equity Current liabilities Long-term Common stock Ontarpaid.in capital Retained Gaming Total abitis & equity 1000 100.0 1000 1000 100.0 % 1000 Required 1 Compis Required 2 >